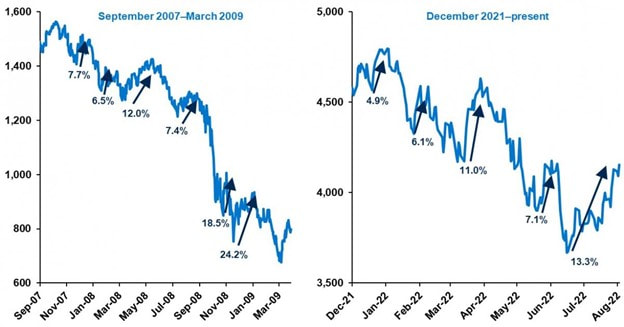
• Home
  • Firm
  • Services
    • Services Summary
    • Retirement Planning
  • Portfolio
    • Our Investment Approach
    • Socially Responsible Investing
  • Custom Approach
    • Difference
    • Financial Planning
    • Retirement Planning
  • Articles
  • Blog
  • Fees
  • Contact
Montecito Capital Management I Investment Advisors


Weekly Stock Market Summary & Monthly S&P 500 Update Oct 2020

10/1/2020

 
October 31, 2020 Weekly Market Update. On the heels of a delayed and uncertain future of the next stimulus package combined with spikes in COVID-19 cases, the U.S. equity markets repriced to new economic headwinds: Dow Jones Industrial Average led the market losses with -6.47% followed by the S&P 500 Index -5.64% and the Nasdaq -5.51%. However, there was also positive economic news this week of preliminary third quarter GDP reading of 33.1% (still a 3.5% year-over-year decline). Keep in mind the capital markets are forward looking and therefore responding to the economic clouds related the virus uptick and no timeline for the next round of the much needed economic stimulus.


October 24, 2020 Weekly Market Update. After several weeks of positive equity gains in the U.S. markets the three major equity indexes lost ground for the week: S&P 500 -0.53%, Nasdaq -1.06% and Dow Jones Industrial -0.95%. Early in the week the markets were impacted by troubled impasse on the stimulus aid package followed by Friday’s disappointing announcement that the House and Treasury Secretary Mnuchin decided no deal can be made before the election. Meanwhile, the economy continues to show improvement with 81% of S&P 500 ("$SPX") companies having beaten revenue estimates for Q3 to date while 84% of $SPX companies have beaten EPS estimates. The monthly survey report on business executive showed the IHS Market flash PMI Indices for services  and manufacturing sectors both rose to new 20-month and 21-month highs, respectively. On the vaccine front, the FDA approved the restart of AstraZeneca’s Phase 3 vaccine trial and J&J also restarted its vaccine trial.


October 17, 2020 Weekly Market Update. The major U.S. equity indexes finished up on a choppy trading week with the Nasdaq leading +0.79% followed by the S&P 500 +0.19% and the Dow Jones Industrial +0.07%. Economic data was mixed with surprisingly strong retail sales while the COVID-19 stimulus package came no closer to agreement other than Mnuchin saying he would “give ground” in stimulus talks while Trump says he would raise his offer.” Markets tend to abhor uncertainty and three big concerns are very much in the air: 1) the very much needed stimulus; 2) who will win the election (as past Biden leads are again narrowing in battle ground states); and 3) when the country will have an effective and reliable vaccine (J&J paused its vaccine trial while Elli Lilly paused its antibody trial). But the obvious big focus is the upcoming Presidential election and legal teams on both sides are preparing to legally challenge the election result if it is close. Earnings season began this week and according to FactSet 82% of S&P 500 (“SPX”) companies have beaten revenue estimates for the third quarter (Q3) while 86% of the SPX of beaten the S&P 500 estimates to-date as of Q3. For example, most major banks announcing earnings results which far exceeded estimates. Consumer sentiment ticked upward by +0.8 points to its highest level since March at 81.2 after rising +6.3 points to 80.4 in September. 


October 10, 2020 Weekly Market Update. The Nasdaq +4.56% led the major indices for a second straight week while the S&P 500 Index and Dow Jones Industrial posted +3.84% and +3.27%, respectfully; this is their best performance since early July. As we enter the last month of the election, the S&P 500 is just 6.5% from an all-time high while the Nasdaq composite is up some +23% and stands just 8.5% from its most recent all-time high (a positive equity trend remains in place which has boded well for the bulls). The markets continue to show optimism about the prospects for Covid-19 treatments, vaccine testing and ultimately a future vaccine treatment by year-end. For example, "Phase 3" trials are quickly progressing for AstraZeneca, J&J, Moderna & Novavax, among others. On the economic front, continuing unemployment claims fell by 1 million to 10.98 million, less than the consensus of 11.5 million, while September ISM Non-Manufacturing Index unexpectedly rose from 56.9 to 57.8.  Also, Treasury Secretary Mnuchin moved upward the stimulus dollar amount to $1.8 trillion on Friday in an effort to keep the Pelosi negotiations on the track for approval before the election. Nonetheless, Biden continues to have a comfortable lead heading into the final election days, and this portends that the market is well aware that whoever wins the election it will be rewarded with stimulus either way. Current economic conditions have been a catalyst for the ballooning money supply with the U.S. government issuance of over $3 trillion in fiscal stimulus while the Fed has also increased the money supply by $3.4 trillion year-to-date.


October 3, 2020 Weekly Market Update. The major U.S. equity indices, despite selling off on Friday, posted gains for the week led by the Dow Jones Industrial +1.87% followed by S&P 500 Index +1.51% and the Nasdaq +1.48%. For our moderate to higher-risk client accounts, we put money to work on Friday when the Nasdaq dropped over -2% on news President Trump contracted covid-19 and was flown into Walter Reed Medical Center. The investment strategy employed was a Nasdaq-100 ETF that is characterized as defined outcome as it offers about +15% tech upside participation with a loss buffer of about -15%. On the economic front, the September jobs report added 661,000 jobs moving the unemployment rate down from 8.4% to 7.9%. However, some major entertainment and travel companies announced new layoffs including Disney's 28,000 permanent theme park layoffs, and American Airlines & United Airlines, furloughing over 32,000 employees. Perhaps this is why the biggest investor focus remains on the status of the next stimulus package where Treasury Secretary Mnuchin and Speaker Pelosi are trying to close the gap between the WH’s $1.6 trillion offer and the House bill of $2.2 trillion (negotiations expected to continue over the weekend).

Weekly Stock Market Summary & Monthly S&P 500 Update Sep 2020

9/1/2020

 
September 26, 2020 Weekly Market Update. The U.S. equity markets finished mixed with Nasdaq rallying +1.11% for its first weekly gain in four weeks while the S&P 500 Index moved downward by -0.63% and the Dow Jones Industrial Average lost -1.75%.  Much of the market focus was larger issues confronting the country such as the death of Supreme Court Justice Ruth Bader Ginsberg and the impact on the highest court’s future, along with speculation on the House’s downward revised Congressional stimulus measure (in effort to find middle ground). The timing of future stimulus also took center stage after Fed Chair Powell expressed agreement that the economy needed more help from the government. However, as clarified by Chief Business Economist at IHS Market on this point with regard to what the multiple rounds of stimulus so far has accomplished: "U.S. businesses reported a solid end to the third quarter, with demand growing at a steepening rate to fuel a further recovery of output and employment."


September 18, 2020 Weekly Market Update. For the week, the Russell 2000 benefitted as investors rotated into undervalued stocks by jumping +2.64% while the S&P 500 lost -0.64%, the Nasdaq fell 0.56% and the Dow Jones finished about flat. Investor focus continues to be on another round of prospective stimulus, vaccines, election and finally the “valuation” word has surfaced this week. We are not raging bulls here as we are only getting any new equity market exposure for clients by using defined outcome ETFs that have loss protection buffers, while enabling additional equity exposure. Yes, the tech sector is both rich and lofty but from a historical perspective it is still dwarfed by the prior peak of 2000 peak at 57x; between 1995 and 2000, the Nasdaq Composite stock market index rose 400%. It reached a price–earnings ratio of 200. What is also distinctly different from 2000 and today is interest rates now are 0.69% (10-yr treasury) versus well over 6% back in 2000. This means two things: (1) the valuation discount rate enables a higher discounted cash flow valuation than past and 2) the alternative investments environment of bonds is not an attractive draw from equities, which is part of the reason new cash inflows have been redirected towards stocks. There is also a big future catalyst for equities and that is a “reliable” vaccine. Other impactful news on the capital markets include the Fed’s commentary that indicated an uncertain pace of economic recovery while it encouraged more government relief and sustained hype-low rates for years, along with the much awaited coronavirus relief bill still be held-up by opposing party political forces.


September 11, 2020 Weekly Market Update. The tech-heavy Nasdaq fell -3.3% for the week, as the top five stocks took a pause and retreated from past highs; Amazon, Microsoft, Apple, Facebook and Google comprise over one-quarter of the market capitalization of the S&P 500 Index. Meanwhile the S&P 500 dropped -2.3% and the Dow Jones Industrial dropped -1.8% for the week. Normally when market internals deteriorate like this and the leaders begin to abate (last week they started to falter), a correction or prolonged consolidation becomes likely. Indeed, the Nasdaq has moved into correction (minus 10% range) phase and typically these allow new bases to be built in leaders (or new rotational sector leaders) set to continue to lead. Certain investor sentiment factors have also been clouded with a failed Congressional stimulus relief package and Dr. Fauci’s view that covid-19 vaccine may not be available until later than expected (& needed); instead of by October vaccine guidance has been pushed out to the end of year, or early next year. The consumer has nonetheless stayed resilient as evidenced by the Auto and Housing sectors.  


September 5, 2020 Weekly Market Update. For the week, tech stocks led the market lower with the Nasdaq losing -3.27% followed by the S&P 500 -2.31% and the Dow Jones Industrial Average -1.82%. After investors have been binge buying tech favorites to excess causing unsustainable valuations with the Fab Five (FB, MSFT, APPL, GOOG & AMZN) it is only natural that the markets let out some steam going into the long holiday weekend. In turn, other companies tied to the economy reopening, experienced an uptick like Carnival Cruises +5% and Macy’s +8%, a sign of some healthy sector rotation in play. The number of first-time unemployment filings decelerated again to for the week of Aug 29 at 950,000, which moved the unemployment needle below 10% for the first time since March.  We used the market weakness as an opportunity to buy a newly priced defined outcome ETF which provides 10% targeted downside buffer with uncapped upside of 87%-89% S&P 500 return participation and fully tradable liquidity.
 

Weekly Stock Market Summary & Monthly S&P 500 Update Aug 2020

8/1/2020

 
August 28, 2020 Weekly Market Update. Nasdaq jumped +3.39% followed by the S&P 500 Index +3.26% and the Dow Jones Industrial Average +2.59% on higher inflationary goals by the Fed of above 2%, coronavirus vaccine progress and continued expectation of additional government support to aid the economic recovery. From a more subtle perspective, COVID-19 is driving changed behavior to where e-commerce sales as a percentage of total retail sales to reach a new peak (21%), over two times the level seen in 2010. Also, with mortgage rates hovering around all-time lows, new home sales jumped another +13.9% in July, the best since December 2006; mortgage applications for home purchase also continue to run some 33% above levels a year ago.


August 22, 2020 Weekly Market Update.
The Nasdaq led the major U.S. equity indices gaining +2.65% followed by the S&P 500 +0.72%; the Dow Jones Industrial Average finished flat on the week.  However, the breadth of the rally has been a narrow one, driven mostly by fan favorite mega-cap tech stocks, causing worries of a bubble.  For example, the percentage of S&P stocks trading above their 200-day moving average fell from 68% at the market's June peak to just 54% at the end of July. Goldman Sachs, however, just recently hiked its year-end target on the S&P 500 to catch up with the historic rally that pushed the market over its record; yet, the bank warned that the U.S. election poses a significant risk to this call. The U.S. capital markets were also boosted by some monster earnings releases by big box retailers of the likes of Walmart & Target, both of which crushed 2nd quarter estimates with strong same-store-sales and e-commerce.


August 15, 2020 Weekly Market Update. The Dow Jones Industrial Average rose +1.81% this week to lead the U.S. equity markets followed by the S&P 500 Index +0.64% and the Nasdaq +0.08%. Insofar as negotiations between Republicans and Democrats for the fifth coronavirus relief package remain at an impasse, Trump has taken his own initiative by signing an executive action for $300 extra weekly unemployment (with the option of the state to kick in $100), along with a few other assistance actions ranging from helping out renters, student loans and payroll tax. The economy is showing some glimpses of recovery with initial jobless claims last week falling lower than expected to 963,000; the past twenty weeks of jobless claims has been in excess of 1 million. Meanwhile airline travel is also showing revival signs as the TSA screened more than 800,000 passengers last Sunday (airlines are also adding back some flights).  With two consecutive quarters of GDP declines, the economy is in a recession yet the unsurpassed stimulus, relief packages and assistance has offset much the pain for large public companies.  The most recent (previous) recession was Dec 2007-June 2009 where equities peaked in early October 2007, two months before the start of the recession, and bottomed on March 9. 2009. The S&P 500 had jumped by +36% before the official expiration of the recession on June 30, 2009. This economic dip turned out to be a U-shaped recovery. If in June 2009, you had thought you had already missed out on those gain then you would have been incorrect, as the S&P rallied another +44% over the course of the next two years.
​


August 8, 2020 Weekly Market Update. For the week, the equity markets posted strong results with the Dow Jones Industrial Average +3.80%, the Nasdaq +2.47% and the S&P 500 Index +2.45% on news Fed stays course with "whatever it takes...", better than expected earnings and ebullient investor sentiment. Case in point a recent Natixus Survey showed results indicating investors on average are expecting 12% return annually from the stock market while at the halfway point for the 2nd quarter earnings there were 215 S&P companies beating expectation, 37 missed and 2 that matched. However, the market continues to be powered by 5 stocks (Apple, Microsoft, Amazon, Google and Facebook) that now make up nearly 40% of the R1000 Growth index.


August 1, 2020 Weekly Market Update. The S&P 500 Index gained +1.73% and the Dow Jones Industrial posted a slight loss of -0.16% on the week. The discounting mechanism nature of the equity markets continues to have stocks rise sharply in anticipation of future improvement on the economic and earnings front.  However, a good part of the market run-up has been led by the top five stocks by market cap (Apple, Microsoft, Amazon, Google and Facebook), now make up nearly 24% of the S&P 500. That means 1% of the stocks—measured in simple, equally-weighted terms—now practically make up their own quartile in market cap terms. That is significantly higher than the prior 2000 peak of about 18%.  The chosen method of getting capital working in this lofty valuation market for the firm is defined outcome ETFs where we capture certain percentages of the market rally upside while having loss buffers between -9 and -30%.  Unemployment claims (1.4M) ticked up again and the annualized -32.9% decline in second quarter GDP far exceeded any prior reading. However, consumption rose +5.6%, a figure that was certainly boosted by the COVID-19 unemployment check of an extra $600 a week; that extra money is now expired going forward until Congress can reach a new agreement.

Weekly Stock Market Summary & Monthly S&P 500 Update July 2020

7/4/2020

 
July 25, 2020 Weekly Market Update. For the first time since the month of May, the Nasdaq reporting its 2nd weekly loss by dropping -1.33%; the Dow Jones declined -0.76% while the S&P 500 stayed largely flat at +0.28%. Jobless claims came in at 1.4 million for the week ending July 18, exceeding expectations; this was the 18th straight week in which initial claims totaled more than 1 million.  Meanwhile time is almost running out to keep or partially replace the extra $600 weekly unemployment as the Senate Republicans and the White House remain at odds with the House on a new Covid-19 relief bill. The S&P 500 has reported a decline in earnings of -42.4% for Q2, which would be the largest earnings decline reported by the index since Q4 2008 (-69.1%).  


July 18, 2020 Weekly Market Update. Dow Jones Industrial Average gained +2.29%, and S&P 500 rose +1.25% while the Nasdaq lost -1.08% on the week. According to Factset Research: “To date, 9% of the companies in the S&P 500 have reported actual results for Q2 2020. In terms of earnings, the percentage of companies reporting actual EPS above estimates (73%) is above the five-year average. The blended (combines actual results for companies that have reported and estimated results for companies that have yet to report) earnings decline for the second quarter is -44.0% on a blended revenue decline for the second quarter is -10.5%. Looking ahead, analysts predict a (year-over-year) decline in earnings in the third quarter (-24.4%) and the fourth quarter (-12.4%) of 2020.”  Meanwhile on the COVID-19 front, the U.S. has now become the worst-affected country in the world with more than 3.6 million diagnosed cases and at least 139,175 deaths. Until a vaccine emerges, the virus will likely continue to spread unless social distancing (with masks) is maintained. The U.S. House recently approved another COVID-19 relief bill—a whopping $3 trillion in assistance to citizens and businesses beyond the first infusion of $2 trillion in March (other countries have passed similar packages).


July 3, 2020 Weekly Market Update. The S&P 500 Index gained +1.76%, Dow Jones Industrial Average rose +0.96% and a slight loss for the Russell 2000 -0.64% on the week. The S&P 500’s returns continue to be propelled and dominated by tech leaders such as Amazon, Apple and Microsoft. The Federal Reserve and government stimulus programs continue to provide market momentum in the throws of grim news where coronavirus cases are resurging in many U.S. states – with some states once again pressing the pause button on certain business sector operations. Meanwhile, many mainstream retailers and restaurants are either closing shop or cutting stores – for example, J Crew, Neiman Marcus, Brooks Brothers and Chuck E Cheese all recently filed for bankruptcy while the likes of Dunkin' Donuts and Starbucks have closed over 400 stores (leading to permanent jobs losses).


July 3, 2020 Weekly Market Update. Equity markets rallied on news that June non-farm payrolls surged 4.8 million, surpassing estimates of 3.06 million. For the week, the Nasdaq outperformed at +4.62% followed by the S&P 500 Index +4.02% and the Dow Jones Industrial Average +3.25%. However, June’s “real” unemployment rate was 18%; a figure that is almost as bad as the 25% rate during the Great Depression. The U-6, or real unemployment rate, includes the underemployed, the marginally attached, and discouraged workers. Markets are cherry picking news and celebrating selective positive economic data while turning a blind eye to worrying surge of coronavirus cases.  Of course, stocks have been fueled by large amounts of excess QE money that has been finding its way into the capital markets. However, this excess QE that the Fed has created has started to decline with the Fed’s balance sheet dropping by $86 billion these past couple weeks. Markets also continue to disregard escalating trade tensions between the U.S. and China.

Weekly Stock Market Summary & S&P 500 Market Update June 2020

6/1/2020


June 27, 2020 Weekly Market Update. Led by big banks, the markets sold off Friday after the Federal Reserve said in its stress test results that it would restrict dividends and share buybacks on financial companies for the third quarter. The Fed stated the action was to “ensure large banks remain resilient despite the economic uncertainty from the coronavirus event.” Hence, all U.S. major equity indices gave back several weeks of gains as the Dow Jones Industrial Average lost -3.31% followed by the S&P 500 Index declining -2.86%. On the technology front, social media stocks including Facebook, Instagram and Twitter also came under pressure due to their policies on censorship. Other market jitters related to Thursday’s new case tally surpassed 40,000 for the first time. States reporting record new cases include Florida, California, Arizona and Texas. Nearly 1.5 million workers filed new state claims of unemployment last week which was higher the expectations. Given the disconcerting news there should have been no surprise when consumer sentiment slipped to 78.1 in the final June reading, down from the 78.9 reported earlier in the month. Consensus economists expected a reading of 79.2; the index of consumer sentiment reached a high of 99.3 back at year-end 2019. 

June 20, 2020 Weekly Market Update. The market edged upward after last week’s sizable losses - S&P 500 Index +1.86% & Dow Jones Industrial Average +1.04% - on news that retail sales is showing some new life with recently released double digit recovery figures (but retail still down -8% since February). In the 1st half of the week the market rallied on retail sales, yet gave back about one-half those gains in the 2nd half on concerns about spiking COVID-19 infections in many states including Texas, Arizona, California, Utah, Florida, Oklahoma and several southern states. The U.S. government also discussed a potential new infrastructure bill and future stimulus, but nothing is imminent. Of interest, a June 2020 WSJ article highlighted the following: “Grappling with the most economic uncertainty in decades and a head-spinning stretch of volatility in the U.S. stock market, many investors have rushed into money-market funds. Assets in the funds recently swelled to about $4.6 trillion, the highest level on record, according to data from Refinitiv Lipper going back to 1992.”  A recent Bloomberg article offers insight on what might be a good part of this unusual market recovery “The role of retail investors in 45% rebound since late March has been intensely analyzed, as a swarm of tiny buyers chased after recovery plays and insolvency stocks. A record number opened new trading accounts in the first quarter.”  Hence, there is market concern of a growing cadre of smaller investors  becoming day-traders and taking outsize speculative market bets (perhaps like the tech bubble of 2000).
 
June 13, 2020 Weekly Market Update. For the week, the Dow Jones Industrial Average fell -5.55%, S&P 500 Index dropped -4.78% and the Nasdaq finished down -2.30%. The focus of the equity price contraction across the board were concerns over COVID-19 spikes related to the economic reopening, along with comments by Fed Chair, Powell. The Federal Open Market Committee’s (FOMC) Summary of Economic Projections indicated the Fed expects a steep 6.5% contraction in real GDP in 2020, with an unemployment rate at 9.3%. Also, weekly initial unemployment claims totaled 1.542 million for the week ended June 6, the Labor Department said in its weekly report.  We sent the following email to clients back on June 8th: “Equity markets have rallied on continued news of business reopening and potential COVID-19 vaccine by late September and insofar as we believe these are justifiable positive catalysts for market gains, we believe market valuations are overextended.  U.S. equity markets are priced similar to where we were at the end of 2019 with the economy running without any foreseeable obstacles and with earnings growth slated for +9%, yet the current economic makeup is nowhere near the robust levels of last year. We therefore are looking for the normal periodical market correction to place additional risk back into portfolios. As Warren Buffett once remarked “Games are won by players who focus on the playing field – not by those whose eyes are glued to the scoreboard” and as such, in the short run the stock market acts like a “voting machine” (reflecting all kinds of irrational attitudes and expectations), while functioning in the long run more like a “weighing machine.” It is also notable that this "world’s best investor" is sitting on a record level of cash totally $139 billion and recently sold Goldman Sachs, Airlines, Energy stocks and Travelers. In closing, as stewards of capital for long-term goals we must weigh the risk-return trade-offs and it is our view that the current market valuations have disconnected with earnings and economic growth, particularly given the consumer (70% GDP) has yet to show a sign of spending at 2019 levels. Hence, we will look for redeploying additional equity risk when valuations have aligned with fundamental earnings measures, or in the event Congress moves to initiate “monthly” stimulus checks (which would certainly reengage the consumer).”


June 6, 2020 Weekly Market Update. The month of May’s employment number was a big surprise for Wall Street, showing a gain of 2.5 million jobs versus an expected 7 million loss.  The markets rightful celebrated and finished the week with the following gains: S&P 500 +4.91%, Dow Jones +6.81% and Nasdaq +3.42%. This positive economic indicator was justifiably supportive of the capital markets upswing. Further, with a potential COVID-19 vaccine slated for potential availability by late September, there remains a number of fundamentally positive aspects to having the economy move into high gear. Our equity outlook issue is now more about equity valuations.  Should the stock market be priced back to where we had a very robust economy at the end of 2019 where we were moving into 2020 with another +9% growth in earnings? To be clear, we are not bearish and hold no shorts or inverse ETFs - rather we believe portfolios should have sufficient cash to offset the risks of lofty equity valuations. For instance on the jobs front, there were a large percentage of simply temporary “furloughed” workers that were easily brought back online and we think the May job report reflected that shift. Keep in mind that employment is still 13% (absolute number) below February figures and, ultimately, consumer spending will dictate the economic recovery path – you can reopen businesses and rehire, but you need the same active consumer mindset (& wallet size) as 2019.  Yes, we are going to see “sequential” increases in weekly and monthly sales across the board since the economy was essentially paused for months – however, all this “recovery” trend will be far below last year’s figures, yet equity valuations will be the same (or higher)?  Investors should have equity exposure to benefit from the recovery, but also keep sufficient cash to offset valuations being over-stretched. Final thought, China trade tensions are escalating.


Weekly Stock Market Summary & S&P 500 Market Update May 2020

5/2/2020

 
May 30, 2020 Weekly Market Update. Market sentiment remains sanguine as the country continues to re-opening businesses and the development of coronavirus vaccine by Fall becomes a possibility. Investors continue to shrug-off news of frightful economic data with the impression that the worst is over, and we have hit the economic bottom. The Dow Jones led all the major U.S. indices +3.75% followed by the S&P 500 +3.01%and the Nasdaq +1.77%. We still recommend portfolios should have meaningful equity and cash positions, keeping both feet placed in potential returns and cautious safety of cash. The reality is there will be obvious sequential improvement in businesses, often with double digit increases, given sales for many industries were severely damaged: for April, retail sales were down -21.6%, auto sales down -53%, airlines sales down -90%, etc. Also, there remains other new risks, such as renewed trade tension with China and simply put, on the home front many business sectors can't operate at the same profit levels anymore until there is a vaccine. Yet, valuations are priced as though the economy was operating at 2019 levels with sizable growth ahead and no uncertainty (2nd wave?).


May 22, 2020 Weekly Market Update. The U.S. equity markets recovered last week’s loses on expectations of a possible COVID-19 vaccine, another phased reopening of the economy and additional stimulus programs underway: S&P 500 Index +3.20%, Dow Jones Industrial Average +3.29% and Nasdaq +3.44%. Recent economic data suggest a national unemployment rate of 14.7% with about 38 million Americans filing for unemployment over the past nine weeks. However, the very valid investing theme grabbed investment professionals’ attention on Monday of this week, and that was a salient excerpt from Fed Chair Powell’s interview: "There's no limit to what we [Fed] can do."  Well, then, the market awaits the Fed fixing the following: Housing starts dropped -30.2% in April, existing home sales report dropped -17.8% in April, unsold product inventory of 4.1-month supply at recent sales pace, 38 million people out of work (of 165 million workforce, or 23% unemployed), overall decreases in manufacturing employment this month with 58% of firms reporting decreases in activity, amount of debt classified as distressed in the U.S. up +161% in just the last two months (to more than half a trillion dollars), etc. The point being is that even with unsurpassed stimulus and Fed liquidity support there still remains an enormous amount of "fixing" to be done by the government and its agencies (Treasury & Fed). That said, we reiterate that investors should have both equity and cash positions to hedge the ultimate outcome which could result in further volatility until the economy is able to both adapt and reinvigorate.

​
May 16, 2020 Weekly Market Update. Stocks lost steam and ground on the week with S&P 500 losing -2.26% on Fed Chair Powell statements indicating the U.S. economy is facing unprecedented risks that "could do lasting damage." Powell said almost 40% of Americans in households making less than $40,000 a year had lost a job in March.  Particularly salient remarks were the following: “The loss of thousands of small- and medium-sized businesses across the country would destroy the life’s work and family legacy of many business and community leaders and limit the strength of the recovery when it comes” and “While the economic response has been both timely and appropriately large, it may not be the final chapter, given that the path ahead is both highly uncertain and subject to significant downside risks.” The stock market is no longer tied to the economy as it is metamorphosizing into the market of the Fed & government stimulus. Typically, the decision of cash would be a no-brainer given the catastrophic economic damage of suspending most business activity for months, but the government seems adamant about backing the entire economy, and many segments of the capital markets, with its balance sheet (both government & Fed). There is a big investment theme for professionals and that is "don't fight the Fed" - so, much of the rebound is also tied to "unlimited liquidity" from Fed Chair Powell. Also, medical/healthcare advances and progress against COVID-19 are inevitable, and the market will celebrate any news on that front. The most recent recovery rally has been more about phased business reopening, but that comes with significant "2nd Wave" risks as well. So, what to do?  Well, in our humble opinion, there are obviously way too many unknowns (including uptick in trade hostility with China) to have all your chips waged on this table. Taking this analogy further, I think it is prudent to take some chips off the table given we are now only -11.7% down YTD. Thus, for those 100% invested, it would prudent to probably pick a day of market strength and reduce some of your winner positions (those with less than double digit losses). Let's do some quick math: GDP economy is losing about $2 trillion a month and all this stimulus is not even matching that drain. Also, let's look at supply-demand: 45% of the supply of economy is small business (2/3 of net new jobs) and these guys are being decimated with probably 30-40% shuttering in next few months; then, demand, we have the consumer being 70% of the economy and they are shell-shocked, many permanently unemployed and will likely have a changed mindset with greater debt and less stable job outlook. Trump is doing everything to get reelected and therefore the only caveat is if the Fed starts buying the stock market with ETFs (it moved into high-yield ETFs this week), then all chips should be back in the game.


May 9, 2020 Weekly Market Update. For the week, S&P 500 gained +3.50%, Dow Jones Industrial Average rose 2.56% and the tech heavy Nasdaq jumped +6.00%, despite another 3.2 million jobs lost on the week. The April unemployment rate reached 14.7%, marking seven-weeks of declines totally 20.5 million jobs; this surpassed the previous post-World War II unemployment rate record of 10.8% (Great Depression was 24.9%). It is apparent that the stock market considers a large swath of these lost jobs as simply temporary in nature, such as furloughs. The markets continue to embrace two big themes in which it considers positive: 1) the economies have established a phased reopening and that many states have entered this first stage and 2) both the Fed and the U.S. government has the stock markets back in the form of unlimited liquidity and immeasurable future stimulus.  Further adding to market strength is progress with COVID-19 testing, treatments, and fast-tracked future vaccines. In short, equity market valuation pricing is very much forward-looking and placing its bets for the best case “V” recovery scenario. We caution that plans involving so many unknowns are unpredictable and therefore encourage investors to have a reasonable cash cushion in portfolio as expectations seem overly sanguine.  Indeed, we predict job losses to have more permanency and anticipate a large collapse in small businesses; we also do not foresee the consumer spending at the same rate as 2019.


May 2, 2020 Weekly Market Update. The U.S. equity markets lost ground for the week with the S&P 500 (-0.21%), the Dow Jones (-0.22%) and the Nasdaq (-0.34%). The S&P 500 remains down -12.4% year-to-date and is still -19.6% off its all-time high of 3,386, reached back in February.  On the week the markets were moved by counter-weighing considerations of the prospects of the U.S. economy initiating a phased reopening versus another 3.8 million workers filing for unemployment (total of jobs lost due to the pandemic is now over 30 million).

Weekly Stock Market Summary & S&P 500 Market Update April 2020

4/1/2020

 
April 24, 2020 Weekly Market Update. All major U.S. equity indexes lost ground with the S&P 500 -1.32%, the Dow Jones -1.93% and the Nasdaq -0.18%. For the week ending April 18, another 4.4 million Americans filed for unemployment benefits. Over the past five weeks, more than 26 million Americans have filed unemployment insurance claims. Further, for the third consecutive week oil prices fell, but this time precipitously as drastic cuts in production still failed to keep pace with an estimated 30% decline in worldwide demand. New auto sales were down -32% in March while consumer spending was down over -25% year-over-year in the past week. According to a recent survey, around 33% of respondents were “within three missed paychecks of having to either borrow money or skip bills.” On the other hand, quantitative easing (“QE unlimited”) continues with the Federal Reserve expanding its balance sheet at a pace of about $41 billion per day. In fact, the Federal Reserve, European Central Bank, Bank of Japan and Bank of England will expand their balance sheets by a cumulative $6.8 trillion. Central banks in Group of Seven countries purchased $1.4 trillion of financial assets in March, nearly five times as much as the previous monthly record set in April. Earnings season had some good news and bad, but it is backward-looking; most U.S. states were still operating at full pace thru mid-March. The tug a war between government stimulus, the Fed and progress against COVID-19 versus severe economic mayhem is impacting capital market price behavior with yo-yo like moves. Our market view has not changed, and we reiterate that we believe the prospects of a gradual “V” shaped economic recovery to be overly sanguine; yet the worst case scenario (Great Depression) is off the table with unprecedented governmental intervention. We still anticipate markets to retrace back downward at some point when it is clear the consumer mindset has changed post-virus, particularly given the consumer (again 70% of GDP) has really taken it in the shorts and a $1,200 one-time stimulus distribution is palpably insignificant.


April 18, 2020 Weekly Market Update.  On the week, the market celebrated any form of good news and largely shrugged-off the very severe, and partly permanent, damage to the U.S. economy. The S&P 500 gained 3.04% while the Dow Jones posted a 2.21% weekly return. Instead of processing and valuing the awful economic toll, the market inflated the new prospective Gilead COVID-19 treatment and the fact that Boeing plans to resume production at one of its plants. Also, market forces clanged to news of WH’s criteria  for reopening the economy. The real market support, however, is that the that worst case scenario is off the table as the government has been aggressively purchasing assets to support the capital markets; the Treasury ledger of assets owned by the Federal Reserve, has ballooned to 6.08 trillion as of April 8. What was not reflected in the markets were a record 22 million people who have sought jobless aid as a result of COVID-19. This is reflected throughout the U.S. economy: March retail sales cratered -8.7% and Philly Fed manufacturing index plunged -43.9 points to -56.6 (lowest since 1980), while Housing starts plummeted -22.3% to 1.21 million in March. Unfortunately for small businesses the $350 billion PPP payroll relief package is already depleted and there are reports some of the biggest beneficiaries were larger companies, which 'reportedly' was an unintended result.


April 11, 2020 Weekly Market Update. After a remarkable rally this week, even the world’s leading investment strategists now hold mixed and often conflicting views on the ultimate direction of the U.S. equity markets. In one camp, there are market strategists who hail this recent market shift out of bear market territory, to where the S&P has now exited the -20% loss range, as a confirming signal that the market has returned to be a bull market phase. In contrast, other market strategists view this week’s rally as only a normal bear market rally that is simply a head fake, which they show supporting historical statistics. Unfortunately, nobody knows the right answer for sure. Case in point, does one piggyback on the government and central bank extraordinary stimulus of pouring trillions of dollars into the economy and, more recently, the central bank ‘actually’ purchasing financial market assets. Or, does one focus on historical Ned Davis Calendar, where on average across the past 11 bear markets, the final bear market low came 137 days after first registering such a loss. Both are compelling arguments where one must weigh the unprecedented scale of government and central bank support against severe economic distress as highlighted by record job losses and virtually an economic seizure, along with the prospect of controlled halt to economic activity for many weeks, or months to come. On Thursday of this week, the Federal Reserve said it could pump $2.3 trillion with expanded programs which includes bond market asset purchases. This is separate from the earlier $2.2 trillion COVID-19 stimulus package. There is no doubt that policy makers are making grandiose gestures with spending to keep boosting the flailing economy and capital markets. However, the typical rule of thumb is that stock markets decline roughly as much as corporate earnings drop, which many expect to fall 25%-38% range over the next few quarters. Also, when looking at past bear markets as a guide, you don’t have a bear market without a bear market rally.  For example, turning to 1929, 1987 and 2008 as guidance, there were all marked by bear market rallies followed by more severe losses later. The market crash of 1929 lasted from Oct. 10-29, which was followed by a bounce that retraced 36% of the crash-phase losses, only to fall even further down later (80%). The crash phase of 1987 lasted from Oct. 2-19, then there was a first bounce retraced 28%, only to reach crash-phase losses again later. The sharpest crash of 2008 lasted was Sept. 19-Oct. 27, followed to the first real bounce retraced 24% of the crash-phase losses, then ultimately falling a total 38%.We are not reinvesting right now as we believe both stimulus vs. historical bear market behavior are likely in play, which will result in the market yo-yoing. First, we have written that we anticipate the market rally on news of COVID-19 infection flatlining trends and new treatment drugs, along with stimulus news. However, running the math shows that all the stimulus is simply covering a large growing gap, not rebooting an economy.  So, here is the math: if the U.S. economy is about $21.5 trillion and the GDP essentially moved offline in mid-March, then the economy has been stalled for about a month now, at a cost of roughly $1.8 trillion lost. Yes, some businesses are still operating, but for sake of simplicity, let’s assume $1.8 trillion evaporates every month and most expect that the economy won’t reopen until mid-May (earliest), with a good part still idled for many more weeks (hotels, airlines, cruise ships, Las Vegas, etc.). Then, let’s say the economy loses two-months of productivity, which is about $3.6 trillion dollars gone from the U.S. economy (recall, COVID-19 was $2.3 trillion). Yes, the central bank is also adding big stimulus, but that isn’t going into the economy, but rather boosting the capital markets so fear doesn’t run rampant – therefore, just superficial stimulus. Finally, let’s say Trump and Congress decide to add a couple more rounds of COVID-19 stimulus to match the $3.6 trillion lost ground (or another $1.3 trillion added), then all that does is cover a gaping economic hole and does not reboot the 10’s of millions newly unemployed, pay consumers’ massively mortgage and utility delinquencies during this period and certainly doesn’t save the hardest hit small businesses that went out of business, like restaurants, gaming, retail, sports, entertainment (concerts, movies, parks, festivals) etc.Yes, the market is celebrating the central bank’s asset purchases in the markets, and also rejoicing in news that businesses and consumers will be helped out with stimulus, but how will the market be reacting to the horrible economic toll numbers that will be released in the weeks to come – probably not so celebratory. Also, I have yet to hear of one business or personal to have received a dime yet from this stimulus, and knowing the inefficiency of bureaucracy, some of the stimulus may be “too little, too late.” Recall, consumer spending is about 70% of the economy and they are hurting the most. Considering this perspective and the current economic landscape, I still think the roughly 28% average cash balance for clients has a good probability of being deployed to buy at lower equity value prices down the road.  To be clear, nobody can say with certainty what will happen, but a little extra cash during times of great uncertainty seems prudent. Also, portfolios are still exposed to the market and therefore benefiting from the recent rally last week. Lastly, in the event trillions upon trillions of more (new) dollars are continually added to both the economy and the markets with additional asset purchases, then we very well may need to rejoin the party with the cash in hand.  But for now, I think we have the right balance of diverse invested assets relative to cash given current conditions.  


April 4, 2020 Weekly Market Update & (Revised) 2020 S&P 500 Market (Directional) Forecast: 
For the week, the Dow Jones Industrial Average led the U.S. index losses at -2.70%, followed by the S&P 500 Index -2.08% and the Nasdaq -1.72%. It was another topsy-turvy week that was impacted by jobless figures (crazy spike), payrolls (down), oil (down, then dead-cat bounce), COVID-19 infections (scary up) and stimulus policy implementation (initiated). Looking back at this bear market, it was initially started with daily free falls in stocks, then over the course of the past weeks the equity markets have been less volatile with more liquidity, yet still oscillating on a downward trajectory. The reality is it will take a long time for the U.S. economy to properly absorb the 2 trillion-dollar stimulus and by the time the economy does, then things will likely be even worse. I look at it this way, the stimulus represents about 10% of GDP, but some Wall Street firms are now looking at the U.S. economy (GDP) contracting almost -40%. So, from the macro perspective, even when the stimulus is fully implemented, the markets should still be down over -25% just as a baseline (+10% -38% = -28%). Yes, there is more stimulus likely to be on the way, but I suspect the full negative impact of COVID-19 on business activity has yet to be foretold. For example, there is going to be a heck of a lot of businesses that will shutter, which will include many bankruptcies for small businesses, and serious downsizing for even the big companies with slashed office footprints, closed retail space, laid-off staffing/workforce etc. The government just can’t throw money at a massive and complex problem, then jump-start the U.S. economy into a “V” shape recovery. That said, at some point, there will still be an opportunity to trade here as the markets are behaving with better liquidity (exogenous help by Treasury w/ asset purchases); therefore, advisers with a thoughtful investment strategy can be opportunistic. Case in point, we plan to reenter the market with phased increments near or at the March 23rd lows. Then later, we think there will be some upside opportunity to sell some of the bottom feeding acquisitions months after on expected future COVID-19 medical treatment announcements down the road. It is our view there is the highest probability that the U.S. equity markets will take a partial “W” course, but flat-line before making the last upswing. Hence, the market will fall (which it did), it will recovery some with stimulus (which it did), will fall again (started, expect further downside), then partially recover again when there is news that COVID-19 is flattening & news of effective medical treatments, then finally decline from there to some (unknown) degree as the market ‘soberly’ processes that the world’s largest economy just can’t restart all engines when many of the largest companies had already taken longer-term “cutback” actions that simply can’t be undone with a magic wand.


First Quarter & March’s Monthly Wrap-up: The S&P 500 index finished down -20% for the first quarter, marking its worst quarter since the fourth quarter of 2008. The S&P 500 was down -12.51% for the month, while the Dow finished off -13.74%.  Except for utilities, the other 11 sectors were down; tech’s big 5 lost a trillion dollars last month.

Weekly Stock Market Summary & S&P 500 Market Update March 2020

3/1/2020

 
March 28, 2020 Market Update. The S&P 500 Index gained +10.3%, the Dow Jones Industrial Average jumped +12.8% and Nasdaq rose +9.1%, marking the largest weekly gains in 11-years. However, the gain momentum was partly offset by strong headwinds on Friday where the the S&P closed off -3.37%. All major U.S. equity indices are still down more than -20% year-to-date with the S&P 500 still down about 25% from its record close on February 12th (at the peak of losses, the index was down about 34%). The broad market index futures area showing a tough Monday morning as it is currently flashing -3.41%. We will look to start dipping our toes back into equities again should (or when) the market retests the March 23rd lows; we have identified several buying targets at different levels. Further, we will target a diverse set of equity ETFs, with unique methodologies such as strong balance sheets, low volatility, strongest dividend history, technology exposure, etc.


March 26, 2020 Market Update. Often the advisor’s best-interest path for clients is the hardest road, and for me that has been frequent, incremental de-risking of client portfolios during periods of market strength. This is a labor-intensive selection processes that takes not only many days, but typically all day when trading. For example, with all the trading that has been done (including today), the average client portfolio cash allocation now stands at about 25% (depending on risk profile some higher, some lower). With all the emails I have sent about active trading, many would think that cash would be crazy high by now, but as explained, portfolios will keep some level of market exposure since you simply can’t pick the best recovery days. In the end, inasmuch as the “averaging out” with phased sell transactions is a rather arduous process, this strategy has effectuated the recapture of incrementally more (& more) lost return ground, particularly the past few days with the market recovery action. Markets were up for two reasons today: 1) Federal Reserve Chairman Jerome Powell made appearance on national TV this morning, professing that the central bank still has plenty of tools left to support a U.S. economy: “When it comes to this lending we’re not going to run out of ammunition, that doesn’t happen,” Powell said. Then, 2) the stimulus bill passed the Senate moving the estimated $2 trillion bill to the House as Congress with optimism. Oddly, a very relevant market consideration that would have normally damaged stocks today was bizarrely absent from trading behavior, and that was a horrific jobs report. In the week ending March 21, the advance figure for seasonally adjusted initial claims was 3.3 million, an increase of 3 million from the previous week's revised level and twice the consensus expectations of 1.6 million claims. This marks the highest level of seasonally adjusted initial claims in the history of the seasonally adjusted series. Given the market shrugged off a frightening jobs report that was not only bad, but ended up twice as worse, then this shows that investors are clamoring for any good news; also investors are becoming more immune to reacting to bad news as we have all had more than our share of frightening headlines.


March 24, 2020. We Continued to Sell Risk Assets During Today’s Market Rally on More Stimulus News. We were active sellers of riskier portfolio assets on today’s record point gain day where the Dow finished up 2,113 points (+11.37%) and the S&P 500 jumped 210 points (+9.38%). The increase in client cash balances from our periodic asset sells during market rallies have served three objectives: 1) adds more “dry powder” to purchase equities at lower levels (more liquidity for opportunity); 2) reduce unrealized loss volatility in the portfolio (less future losses) in bear market; and, 3) capital protection provides a layer of sleep at night factor. Also, we have only executed sell trade actions for all client accounts on days of strong market strength. Hence, we are not participating in fear-selling. The government, Fed and the central banks are moving forward to throw $2 trillion at the COVID-19 problem, with the Fed essentially indicating QE will be unlimited. The government stimulus includes tax rebates/checks for individuals, corporate tax relief, small business loan forgiveness, bailouts/aid for distressed industries, extended/enhanced unemployment benefits and public health spending. Similarly, the Fed intends to increase the amount of liquidity in the repo market to highest ever, restarted quantitative easing (QE) by expanding maturity range for its $60 billion/month purchases, started new QE programs, buying $500 billion in treasuries and $200 billion mortgage-backed securities (MBS), allowing banks to use capital and liquidity buffers, etc. However, while this stimulus will certainly be helpful, it is important to keep in mind that back during the 2008 crash, it took four months and -40% in S&P 500 losses before stimulus started to work. Now Trump said he also wants to put people back to work by Easter (or in 2.5 weeks), but during this announcement his head of CDC was notability absent. A model of potential outcomes in the U.S., released by the CDC last Friday, showed as many as 1.7 million Americans could die from the virus, and between 160 million and 210 million Americans could contract COVID-19. Fortunately, those CDC estimates sped up and heightened the U.S. response to curtail the pandemic. These events remain unchartered waters as we just don’t yet know how long until the workforce will be re-engaged, when companies will restart their growth & capital investments, when the consumer will feel comfortable enough to resume the robust consumption of past years, etc.  It is our goal to continue to adapt client portfolios to this new reality where we are processing many different data points to execute trade decisions. For example, corporate bonds typically help offset equity losses during market stress, but this asset class has also lost ground due to credit rating worries; thus, we have also taken action to reduce the lower (credit) quality bonds in portfolios.  We remain comfortable with cash being a large asset class as we have a significant cash hoard built-up to reenter the capital markets at (hopefully future) bargain prices. It is unlikely that we will pick the bottom, but I would rather pay-up for greater visibility and certainty than trying to catch a falling knife (investing during a collapsing market). I leave you with one of the founding fathers of economics own words, John Maynard Keynes, who said in the 1930s: “Markets can stay irrational longer than you can stay solvent.”


March 21, 2020 Market Update: First, we would like to recap the tone of our approach to the market with our published opinions (& trading actions on client accounts) throughout the market upheaval mayhem (views that were in place at the beginning of the onslaught and collapse): “This portfolio risk reduction action also takes account that other forms of U.S. government stimulus will likely occur, such as bailouts of certain travel/transport sectors, along with perhaps central bank asset purchases. We are also mindful that in a year of elections, incumbents such as Trump will take inordinate action to keep the party going”; “we do tilt portfolio risk down, while also keeping some level of market exposure”; “we have been geared to be sellers on this news and used this opportunity to reduced risk for all client accounts. Insofar as we believe the duration of this financial crises will be shorter than that of 2000 and 2008, the depths of losses could be more severe during the short-term. Again, we believe there will be more bad news than good over the next few months and therefore have been very active in selling..”, etc.  For the week, the Dow Jones Industrial Average collapsed -17.3%, the largest weekly decline since October 2008; the Dow is 35.2% below its recent February high.  The other major indices dropped by double digits for the week: the S&P 500 Index ‑15.0%, and the Nasdaq -12.6%. Both the S&P and the Nasdaq posted their worst weekly performances since the financial crisis in 2008. We have provided periodical correlation updates on client portfolio exposure to the market losses and what is meaningful is, due to both diversity and actions to reduce risk, the exposure to losses have been shifting lower and lower for our clients. For example, on Friday when the S&P 500 lost -4.34%, the range of loss exposure for our client portfolios was about 0.35%-to-1.35% loss, or a correlation of only 10%-30% loss exposure. In closing, our views have not changed and we will continue to be sellers on any material equity market rally. We continue to believe there will be more bad news than good over the next few months and don’t think the markets have found a bottom yet. Also, we recount another published view “over the 20-year period from Jan-1999 to Dec-2019, if you missed the top 10 best days in the stock market, your overall return was cut in half. That's a significant difference for just missing 10 days of investment exposure.  Thus, we need to keep some market exposure as we are not smart enough to know when those 10 days will occur.”


March 17, 2020 Market Update: As we predicted, COVID-19 related economic slowdown just prompted a massive government stimulus proposal of $1 trillion, including an effort to put money into consumers’ pockets. Indeed, Treasury Secretary Steven Mnuchin is pitching Senate Republicans on a package that would include up to roughly $250 billion in direct payments to Americans. The Trump administration is also supporting a request for $50 billion in economic relief for the airline industry as part of the broader package. The $1 trillion package would come in addition to another $100 billion-plus package passed by the House that aims to provide paid sick leave, unemployment insurance and other benefits for impacted workers. As also expected, the U.S. equity markets rallied on this news with the S&P 500 finishing up +6%. As repeatedly conveyed to clients, we have been geared to be sellers on this news and used this opportunity to reduced risk for all client accounts. Insofar as we believe the duration of this financial crises will be shorter than that of 2000 and 2008, the depths of losses could be more severe during the short-term. Again, we believe there will be more bad news than good over the next few months and therefore have been very active in selling this headline for client accounts. It is our view the economic costs of a large swath of U.S. businesses operating with austere staffing, and in many cases at a complete pause, has yet to be fully valued (discounted) in the markets. It just isn’t travel, retail, hotels, sporting events, cruises, concerts, etc., as the consumer is checking out. It is simply hard to imagine the engine of the economy - that being the consumer at 70% GDP - to be a robust participant in broad spending when quarantined. Further, this would not be the time for companies to undergo large expansion, capital expenditure or stock buybacks (which many have agreed to cease). 


March 14, 2020 Weekly Capital Market Update. The week was messy, showing signs of sharp fear-driven selling followed by a sharp market rise - U.S. equity markets sold off the highest point loss since 2008, then marked the largest percent gain since 2009. The S&P 500 closed the week off 19.9% from the all-time high, but at one point dropped by about 26%, which technically was in bear market territory (anything over 20%). Market volatility will likely remain elevated, and momentum will likely be centered on the outlook for the COVID-19 (& its impact on companies), juxtaposed with the effectiveness of health containment initiatives and fiscal/monetary policies. We traded throughout the week and will continue to look for opportunities to move portfolios toward more defensive allocations given we still believe the markets have yet to find its lows; there will likely be more bad news than good news over the course of the next 2-3 months. Case in point, fear rhetoric is very powerful and often can bypasses reason, and this panic emotion can cascade into knee-jerk market decisions. For example, more people will be sent on home-leave from work, less items will be available at stores, their friends and family might (at some point) have serious health problems, parts of their community might be quarantined, hospitals might be at overcapacity, then.. how do they react with their investments? Yes, part of the market reaction is the economic toll of COVID-19, but investors' fear-behavior will also inevitably be disruptive to the markets. So, why not just move to cash and sit on the sidelines? Pulling all the way out of the market has adverse implications on a portfolio. Looking back over the 20-year period from Jan-1999 to Dec-2019, if you missed the top 10 best days in the stock market, your overall return was cut in half. That's a significant difference for just missing 10 days of investment exposure.  Thus, we need to keep some market exposure as we are not smart enough to know when those 10 days will occur. That said, we do tilt portfolio risk down, while also keeping some level of market exposure. The lesson is investors are only rewarded in the long-run, and that means sticking to your investment plan. Until Friday, the market seemed to be missing the other side of this crisis: The recovery will come at some point in the future as the U.S. will sooner or later overcome the coronavirus, and when this happens the economy will benefit from record low interest rates, extremely low energy costs, tax cuts and stimulus packages. Chances are that the US economy will have a strong recovery when the coronavirus crisis is over, and the stock market would naturally be the beneficiary. However, that likely won’t matter in the near-term as panic emotions fail to be rational and will probably overlook that markets typically recover within 6-12 months of past pandemics, whatever they have been. This isn't some permanent, structural event. Yes, madness of crowds rarely lasts, but that doesn’t mean panic behavior won’t distort markets in the short-term. We already are seeing sharp drops in new coronavirus cases in China and South Korea. Warmer weather and higher humidity of Spring and Summer is expected to also help slow the spread of the virus. As enormous as this pandemic is, the 2008-2009 recession was worse. COVID-19 should be temporary because the world is finally taking extreme measures for containment (along with citizens), and treatments and vaccines will be released in due course.


March 6, 2020 Weekly Capital Market Update. We contend COVID19 will lower U.S. and global corporate earnings this year from the previously expected +9% EPS growth rate, to a lower, declining range of minus (-) single digits. The reality is U.S. business activity has been curtailed, including new overseas investment and international trade, all of which will drag U.S. corporate profitability.  Further, we believe prospective consumer sentiment will sour and the consumer has been a driving factor for economic growth. Ultimately, these factors compress valuations going forward and thus we believe portfolio growth exposure should, accordingly, be reduced. While Fed's accommodative action of reducing rates by -0.50% should theoretically be stimulating for the economy, rate action is like using a rifle to stop an ant invasion. For example, with the threat (& fear) of OCVID19, the Fed’s more attractive lending rates simply won’t make people fly to the Olympics, won’t spur people into shopping centers or movie theaters, won’t motivate people to attend global conferences, and certainly won’t urge people to go on vacation. There are simply too many unquantifiable unknowns which the markets have yet to properly process. This portfolio risk reduction action also takes account that other forms of U.S. government stimulus will likely occur, such as bailouts of certain travel/transport sectors, along with perhaps central bank asset purchases. We are also mindful that in a year of elections, incumbents such as Trump will take inordinate action to keep the party going. Fortunately, current portfolio allocations are already substantively diversified amongst many asset classes, which has helped mitigate portfolios from the intense negative market volatility. To be clear, at this stage, we are in no way panicked and not moving to risk-off, but rather taking thoughtful, strategic shifts that correlates to negative impacts on the economy, where the flight path of corporate earnings has shifted downward.

Weekly Stock Market Summary & S&P 500 Update for February 2020

2/1/2020

 
February 26, 2020 COVID-19 outbreak & the markets: The S&P 500 posted its worst day since 2011 and all major US equity indexes plunged more than -4.4% on Thursday, each entering correction territory. That means the U.S. equities have fallen more than -10% from recent highs.  Further, equity markets are down another 2-3% today. It is our view that institutional equity exposure was overly bullish toward equities and were aligned with the assumption that the global economy and corporate profits were not going to be meaningfully impacted by the virus. However, with increasing spread of the virus, only now (this week) is institutional investor risk in portfolios now being aligned downward.  Our client portfolios have layers in greater diversity than the average investor portfolio – bonds, treasuries, real estate, gold, alternative strategies (including mutual hedge funds), preferred shares, convertible bonds, etc. - therefore our client portfolios have had only partial exposure to these losses, in the range of 0.35%-0.55%. Periodic corrections in the markets are to be expected and occur every 14-16 months – thus, the markets were pre-exposed to recede given the last correction happened over 26 months ago (Dec 2018).  At this stage, our portfolio risk mitigation has been relatively helpful during this crisis and until we foresee significant change in the world’s largest economy – the U.S. market – then we remain properly aligned.  To recap, the volatility spike by the U.S. capital markets reflects growing virus outbreaks in Europe and Asia, including relatively large-scale new quarantines in cities that now have extended outside of China.  The CDC warned of the “inevitable” spread of coronavirus in the United States, but so far America has been ahead of the game in taking strong quarantine action.  Although China announced a drop in new confirmed cases, the number of infected people jumped in South Korea to more than 2,022.  The economic impact of unknowns are rattling markets as it relates to magnitude of impact on global supply chains, trade, tourism and travel-related business. 


February 14, 2020 Weekly Capital Market Update. Even as the Fed Chair, Jerome Powell, cited the potential threat from the coronavirus in China to the U.S. House of Representatives this week, he nonetheless reassured the markets: “With risks like trade policy uncertainty receding and global growth stabilizing, we find the U.S. economy in a very good place, performing well.”  The Nasdaq (+2.21%) led the major indices followed by the S&P 500 Index (+1.58%) and the Dow Jones Industrial Average (+1.02%). 


February 7, 2020 Weekly Capital Market Update. While the China-originated coronavirus disrupted short-term market trends, other political and economic events deemed positive by the markets took center stage on the week: The Nasdaq rallied +4.04%, followed by the S&P 500 Index +3.17% and the Dow Jones Industrial Average +3.00%. Though unconscionable to many, U.S. stocks celebrated Trump’s acquittal in the Senate (yet, remains impeached by House), along with news that China will reduce tariffs by 50% on some U.S. products and 225,000 jobs were added in January (far exceed the 161,500 expected). With about two-thirds of the companies in the S&P 500 having already reported fourth quarter(Q4) earnings results, 65% of companies have beaten revenue estimates for Q4 to date; above the 5-year average of 59%. Insofar as the capital markets have appeared to of downgraded the alarming potential ramifications of the coronavirus, we will continue to closely monitor developments with respect to potential negative impacts on U.S. companies operating overseas, along with certain industries having greater risk exposure (Disney, Airlines, Cruise lines, Shopping Centers, etc.)


February 1, 2020 Weekly Capital Market Update. A sharp uptick in coronavirus outbreak trends sparked fears over the potential impact on the U.S. economy this week; 27 countries, 12,000 infections and 250 deaths.  On the week, the Dow Jones Industrial Average lost -2.53%, the S&P 500 dropped ‑2.12% and the Nasdaq declined -1.76%, marking the 4th worst market drop over the last 12-months. Given there remains many unknowns about how pervasive this virus will become, investor sentiment has initiated small defensive asset allocation plays. However, given the current makeup of our client portfolios already have a number of defensive positions, and we don’t foresee making any short-term risk-off portfolio changes.  We intend to stay the course unless (or until) there is an impetus for any shifts that would align with potential longer-term negative market impacts.

Weekly Stock Market Summary & S&P 500 Update for January 2020

1/1/2020

 
January 24, 2020 Weekly Capital Market Update. The Dow Jones Industrial Average (-1.22%) posted the biggest decline followed by the S&P 500 Index (‑1.03%) and the Nasdaq (-0.79%) on news that the coronavirus has reached elevated spread risk, all of which overshadowed positive corporate earnings. With about 16% of the 500 companies in the $SPX having reported earnings, 73% have beaten EPS estimates for Q4, above the 5-year average. Further, reported corporate net profit margin is running at relatively healthy 10.7% for Q4. The U.S. equity markets will be keenly focused on the upcoming corporate earnings of four market leaders next week: Apple, Microsoft, Facebook and Starbucks.


January 17, 2020 Weekly Capital Market Update. The Nasdaq (+2.29%) led the major indices, followed by the S&P 500 Index (+1.97%) and Dow Jones Industrial Average (+1.82%) on positive trade, economic and earnings news. On the week, the U.S. and China signed the Phase One agreement and the U.S. Senate approved the USMCA agreement. Fourth quarter corporate earnings season started well with better-than-expected results, particularly in the banking group with names like JP Morgan Chase, Citigroup and Morgan Stanley. During the JP Morgan Chase earnings call, CEO James Dimon, provided positive commentary on the U.S. consumer (which is 68% of GDP): “Wage growth is up.  Their home values are up.  And the amount of the income they have that goes to servicing interest expense is as low as it’s been in 50 years.” Another positive data economic point is the consumer balance sheet, where the average "Fico" score was reported at a record high in 2019. Also, the Philly Fed manufacturing index jumped 14.6 to 17.0 in January, much better than forecasted.


January 10, 2020 Weekly Capital Market Update.  For the week, the S&P 500 Index and the Dow Jones Industrial Average gained +0.94% and +0.66%, respectfully, on news that Iran-U.S. conflict escalation was muted with a singular Iran response having no U.S. casualties. While Friday’s jobs report for December was positive, it was somewhat disappointing (below expectations) at 145,000 new jobs. Next week corporate earnings season will begin, offering insight on the financial health of the S&P 500 companies for 2020 with a diverse group slated to release numbers, including Delta Airlines, Citigroup, JP Morgan and Kinder Morgan. A week does not a year make, but it may offer some clues as to where the market will end 2020. History shows that the S&P 500 index has ended the full year in the same direction as it began it in 82% of presidential-election years since 1950, according to data compiled by Dow Jones Market Data. The first week of the year (which ended positive in 2020) is a stronger indicator in presidential-election years than in others. 


Excerpts from The 2020 Capital Market Outlook (only existing & prospective clients receive entire comprehensive forecast and strategy newsletter)
As we enter the New Year and contemplate the opportunities that the investment landscape may offer in 2020, it helps to look back at the performance trends of past years. It is our view that a good part of 2019’s gains were driven from an unjustified low baseline of 2018 where the S&P 500 lost (6.2)%, which in turn, set a depressed stage for both a recovery of lost ground and fundamental merit-based market gains. Recall, 2018 ended on particularly ugly note where investors were deeply rattled in December with a (9.2)% loss for the month, yet this fallen value baseline also set artificially low expectations for 2019. With market sentiment downtrodden entering 2019, the stock market was poised to rally as the Fed switched to cutting rates and a China trade war truce took hold; indeed, policymakers reversed course, with a trio of Fed rate cuts and a generous dose of new asset purchases fueling stock market gains.
 
2019 turned out to be a year filled with unfulfilled fears and unmaterialized worries about global economic slowdown, disruptive trade war and potential missteps from Federal Reserve. Hence, when it became abundantly apparent that the U.S. economy was the cleanest shirt in the world and impervious to potentially harmful trade wars, such as expectations of heated escalation, the Dow was propelled upward to+22.3%, its best year since 2017, while the S&P 500 saw its best year since 2013, gaining +28.9%. 

In our opinion, the backdrop for equities and other risk assets remains favorable in 2020 and reflects a market narrative of slower growth economic, benign inflation globally, generally accommodative monetary policy globally, and equities still attractive relative to bonds. We believe in 2020 the market will operate on the premise that the Fed will remain on the sidelines and intervene should there be excessive (>10%) downside market volatility. Additionally, the Fed has said it expects to leave rates unchanged for 2020, giving investors clarity on top of what remain historically low rates.

Wall Street’s consensus forecast for the S&P 500 for most years typically falls in the 5%-to-10% range. Right now, CNBC's strategist survey shows a median predicted 2020 S&P 500 gain of +6.5% to 3375, while the maximum price target shows the S&P 500 could potentially breakout upward to 3,995, or +24% (according to Julian Emanuel, BTIG chief strategist). It is also our view that the market in 2020 is poised for high single digit returns.
 
Our forecast is supported by not only economic factors, the Fed’s supportive stance (don’t fight the Fed!) and government stimulus ($1.4 trillion budget), but also thematic data on where we are in the cycle based on a historical basis. Since 1952, the Dow Jones Industrial Average has climbed +10.1% on average during election years when a sitting president has run for reelection, according to the Stock Trader’s Almanac. Moreover, since World War II, the S&P 500 has gained more than +20% in a year 24 times; and then in the following year, stocks finished higher 80% of the time (or 19 times) with the average gain totaling +13%. In 16 of those 19 years, the market gained double digits.

Overall, we got a pretty good, robust, resilient economy right now. Watching US Treasury rates across the curve in conjunction with the shape of the yield curve offers key confirming signals as to the market's expectations about future growth/inflation. We remain focused on US Treasury rates as the best "market-signal" as it relates to U.S. economic expectations and as we enter 2020.


Weekly Stock Market Summary & S&P 500 Update for December 2019

12/1/2019

 
December 20, 2019 Weekly Capital Market Update. The U.S. equity indices all continued their march upward on the week driven by positive consumer spending and Trump’s comments about his talks with China’s President Xi: The Nasdaq +2.18% outperformed followed by the S&P 500 Index +1.65% and the Dow Jones Industrial Average +1.14%. A key to U.S. economic growth and a major focus for investors is consumer spending and after this indicator rose +0.4% in November, this uptick added to a string of other upbeat data that overall have helped put a damper on recession fears. For example, other positive economic data includes household spending and business activity, which rose to a five-month high. Also, Trump claimed progress on issues from trade to North Korea and Hong Kong after speaking with Chinese President Xi Jinping. Indeed, President Xi stated that the trade ‘agreement is good for both countries and he looks forward to a formal signing as soon as possible.’ Lastly, another economic engine is expected to start kicking-in after the U.S. House of Representatives (finally) passed the USMCA [U.S.-Mexico-Canada] trade agreement with bipartisan support.


December 13, 2019 Weekly Capital Market Update.  For the week, the Nasdaq +0.91% led the market gains followed by S&P 500 Index +0.73% and the Dow Jones Industrial Average +0.43% on reports of Phase One trade agreement between U.S. and China.  The deal cancels the 25% tariff on $160 billion of Chinese good scheduled for Sunday while, in turn, China agreed to purchase an extra $200 billion in U.S. agricultural, energy and manufactured products (along with efforts to halt counterfeiting, patent and trademark violations).  The Democrat-controlled Congressional House of Representatives finally announced their approval of amendments to the USMCA pact which is a critical trade agreement with U.S.’s two largest trading partners, Mexico and Canada.  Also, on the week the U.K.’s conservative party prevailed in majority of Parliament, paving the way for likely Brexit by Boris Johnson (PM).


December 7, 2019 Weekly Capital Market Update. Even after the blockbuster jobs report on Friday and subsequent market rally, the days positive ground was not able to overcome the week’s earlier losses stemming from news China- U.S. trade pace of progress has stalled. President Trump’s scheduled December 15th deadline for tariffs on Chinese goods. For the week, the S&P 500 lost -1.26%, the Dow Jones Average dropped -1.72% and the Nasdaq dropped -1.59%. Friday’s jobs report showed an unexpected gain of a whopping 266,000 jobs for November moving unemployment to a new 50-year low of 3.5%.

Weekly Stock Market Summary & S&P 500 Update November 2019

11/2/2019

 
November 29, 2019 Weekly Capital Market Update. The stock market not only rose for the third straight month, but the S&P 500 hit another all-time high for the week on positive economic news and stability of U.S.-China trade talks (which was recovered from jitters related signs two bills backing Hong Kong protesters.. Bravo!).  On the week, the S&P 500 returned +1.49%, the Dow Jones gained +1.31% and the Nasdaq rallied +2.09%. Shoppers spent $4.2 billion online on Thanksgiving, a 14.5% increase from last year and a record high, according to data released by Adobe - overall sales are expected to exceed $9 billion. According to Factset, 113 of the S&P 500 companies have cited the term "tariff" during earnings calls for Q3, which is 13% below the number for Q2 (130) over the same time frame.  Also, 60% of S&P 500 companies have beaten revenue estimates for Q3 to date, above the 5-year average of 59%. Third quarter (Q3) GDP growth was raised up to 2.1% in the second reading, better than expected, versus the 1.9% clip in the earlier reports.


November 22, 2019 Weekly Capital Market Update. The U.S. equity market declined for the first time in seven weeks on uncertainty regarding the signing of U.S-China trade agreements. Also, President Trump is expected to sign a bill that supports Hong Kong protesters, which could further damage prior progress made in China trade negotiations. The Nasdaq fell -0.25% followed by the S&P 500 Index -0.33% and the Dow Jones Industrial Average -0.46%. The best performing sectors for the week were health care and utilities, while the worst performing sectors were industrials and materials. On the economic front, however, there were positive trends with the preliminary November purchasing managers indices (PMI) for both manufacturing and services rising to a seven-month and four-month high, respectively. Additionally, strong corporate earnings reports from Target, Nordstrom and Hibbett showed uplifting trends that consumers continue to support economic growth.        


November 16, 2019 Weekly Capital Market Update. The major U.S. stock market indices finished positive for the week buoyed by Chairman Powell’s statements that he didn’t foresee “day of reckoning” coming for the US anytime soon and does not see signs of bubbles brewing in what he called “sustainable” markets. Consequently, the markets demonstrated resilience against news that U.S-China trade negotiations stalled due to China wanting tariffs to be removed once the first stage agreement is signed.  In turn, the U.S. wanted further commitments from China on long-term purchases for U.S. goods.  The S&P 500 Index finished up +0.88%, the Dow Jones Industrial Average rose +1.17%, while the Nasdaq +0.77%.


November 8, 2019 Weekly Capital Market Update. Spurred by positive corporate earnings and ongoing U.S.-China trade deal progress, U.S. stocks continued the upward climb for the week. The S&P 500 Index rose +0.85%, The Dow Jones Industrial Average gained +1.22% and the Nasdaq finished up +1.06% for the week. S&P 500 corporate earnings have been on the upside with 60% of companies beating revenue estimates for the third quarter (Q3) to date (above the 5-year average) of 59% while 75% of S&P 500 companies have beaten EPS estimates to date for Q3 (above the 5-year average of 72).


November 1, 2019 Weekly Capital Market Update. The U.S. equity markets were supported as corporate earnings continued to outperform expectations while the strong job report in October was further boosted by upward revisions adding 95,000 jobs to August and September reports.  According, the S&P 500 Index and the Nasdaq reached new highs as investors moved from safe harbor U.S. Treasuries into the equity markets. For the week, the Nasdaq led the gains with +1.74%, followed by the S&P 500 +1.47% and Dow Jones Industrial Average +1.44%.  As anticipated, the Federal lowered interest rates by -0.25% on Wednesday and Chairman Powell stated that “The current stance of [interest-rate] policy is likely to remain appropriate as long as the economy expands moderately and the labor market stays strong...”  On Friday, China indicated that “it reached consensus in principle” with the U.S.  in this week’s trade talks for the Phase One. More specifically, China said the two sides conducted “serious and constructive” discussions on “core” trade points and talked about arrangements for the next round of talks.

Weekly Stock Market Summary & S&P 500 Update October 2019

10/1/2019

 
October 27, 2019 Weekly Capital Market Update. All U.S. equity indexes were positive on the week with the Nasdaq leading the gains at +1.90% followed by the S&P 500® Index +1.22% and the Dow Jones Industrial Average +0.70%.   China is pressing the U.S. to scrap the September and December tariff increases before significantly boosting agricultural purchases over the next two years as progress continues towards a Phase One agreement that Trump and Xi are expected to sign in November. So far with over 1/3 of the S&P 500 companies have reported, 80% of companies have beat EPS estimates to date for Q3, above the 5-year average of 72%; yet 9 of 11 S&P 500 sectors are reporting a year-over-year decline in net profit margins.  Next week investors will remain focused on trade and earnings reports.
Picture
-October 19, 2019 Weekly Capital Market Update. The S&P 500 equity index posted its 2nd consecutive weekly gain of +0.54% on the strength of corporate earnings. For the week, the other U.S. indexes were mixed with the Nasdaq +0.40% while the Dow Jones Industrial Average fell -0.17%. With about 15% of the S&P 500 companies have reported, 84% of companies have beat EPS estimates to date for Q3, above the 5-year average of 72%.  That said, revenue growth is running around +2.6% for Q3 2019, which would be the lowest revenue growth since Q2 2016. U.S. and Chinese negotiators are scheduled to meet next week to discuss Phase II trade agreement terms.  Also, yield curves are finally normalizing, which means short to longer maturity has a steepening slope - no longer inverted.


-October 11, 2019 Weekly Capital Market Update.  For the first time in four weeks, all U.S. equity indexes finished positive on news of improved China-U.S. trade relations: S&P 500 Index increased +0.62%, the Dow Jones Industrial Average was up +0.91% and the Nasdaq rose +0.93%. The White House announced the suspension of tariffs scheduled for next Tuesday on $250 billion worth of Chinese imports, and in turn, China agreed to purchase between $40-$50 billion of U.S. agricultural goods. Further, President Trump said that the U.S. and China had “agreed in principle” on a preliminary deal and added “we are very close to ending the trade war.” However, this “first stage” agreement has no impact on the preexisting tariffs costs and related negative ramifications on economies of both the U.S. and China. Next week market focus will be on the early company releases as earnings season starts; expectations are, once again, muted due to the preexisting tariff regime that has yet to be resolved. 


-October 4, 2019 Weekly Capital Market Update. The equity returns for the week were mixed as the Nasdaq gained +0.54% while the S&P 500 Index and Dow Jones Industrial Average posted losses of -0.33% and -0.92%, respectively. Through September, the S&P 500 Index posted a year-to-date gain of 19%, its best performance since 1997. The U.S. economy continues to reflect on-going tariff-related stresses with 3rd quarter growth estimates ranging from as low as a 1.3% annualized rate to as high as a 1.9% pace. The economy grew at a 2.0% pace in the 2nd quarter, slowing from a 3.1% rate in the January-March period. Remarkably, robust U.S. employment hit a new milestone with the economy adding 136,000 jobs in September, moving unemployment down to 3.5% (the lowest level since December 1969). Unemployment rate usually rises ahead of a recession, so continued declines pushes out the timeline for any potential recession into late 2020. The markets were also impacted by a negative overhang related to political uncertainty in Washington after the Democratic-controlled U.S. House of Representatives impeachment inquiry against Trump, along with news that manufacturing shed 2,000 jobs last month - the first decline in factory payrolls since March. 

Weekly Stock Market Summary & Weekly S&P 500 Update Sept 2019

9/1/2019

 
-September 27, 2019 Weekly Capital Market Update. The S&P 500 Index lost -1.01%, Dow Jones Industrial Average slipped -0.43% and Nasdaq dropped ‑2.19% as impeachment overshadowed the week’s corporate, trade and economic news.  In terms of performance, defensive sectors such as utilities and consumer staples led markets higher, while health care and energy sectors were the market laggards.  On the political front, with democratic front runner Biden under scrutiny and Trump under an impeachment inquiry, markets have been jittered with the rising prospects of Elizabeth Warren who is feared by Wall Street with her disruptive new tax regime ideas.  Further, it appears markets have historically been negatively impacted by past Presidential impeachments: back when Watergate unfolded during the 1973-74, stocks plunged to bear market levels but bottomed less than two months after Nixon resigned rather than face impeachment. Stocks also dropped through the fall of 1998 as it became clear President Clinton had lied under oath about his sexual relationship with Lewinsky. Early this week, China, in a sign of goodwill, granted tariff waivers for the purchase of soybeans, pork and other agricultural products. 


-September 20, 2019 Weekly Capital Market Update. The U.S. equity market retreated for the week on news of disruption in the bank overnight repurchase markets where the Federal Reserve Bank of New York added $75 billion to the financial system on both Thursday & Friday. The Fed then laid out plans for further liquidity injections going forward. Rates on short-term repos briefly spiked to nearly 10% earlier this week as financial firms scrambled for overnight funding. The actions marked the first time since the financial crisis that the Fed had taken such actions. The central bank said it would offer a series of daily and 14-day term overnight repurchase agreements, or repos, in the coming weeks for an aggregate amount of at least $30 billion each. It also announced daily repos for an aggregate amount of at least $75 billion each until October 10. Other concerns weighing on investor minds were the drone attack on Saudi Arabia’s oil facilities, disrupting more than 5% of global supply and oil prices surging by nearly 10%. For the week, S&P 500 receded -0.51%, the Dow Jones Industrial Average dropped -1.05% and the Nasdaq fell ‑0.72%. 


-September 13, 2019 Weekly Capital Market Update. The S&P 500 Index rose +0.96%, the Dow Jones Industrial Average gained +1.57%, and the Nasdaq finished up +0.91% on the third positive week. U.S.-China trade tariff tension de-escalated as China eased tariffs on several products (lubricating oils, alfalfa, etc.) and said it will exempt soybean and pork, which in turn prompted President Trump to then delay tariff increases scheduled to take effect on October 1st. Another upcoming silver lining is next week’s Federal Reserve meeting, where it is widely expected Chairman Powell will announce another 0.25% interest rate cut.  There also appears to be a capital flow from growth stocks to value stocks, indicating better balance in weighted holdings (momentum stock have been overplayed). The NFIB report highlighted “Next week, the Federal Reserve is widely expected to announce another interest rate cut.”


-September 6, 2019 Weekly Capital Market Update. Leading the major indices for the week, the S&P 500 Index gained +1.79%, followed by Nasdaq +1.76% and the Dow Jones Industrial Average finishing up +1.49%.  For the second week, the U.S. equity markets were largely supported by elevated China-U.S. trade deal expectations, followed by employment numbers and accommodative remarks by Fed Chair Powell.  The ISM Non-Manufacturing Index bounced up with higher-than-expected expansion of the service economy while ADP reported 190,000 new jobs compared to estimates of 150,000. Fed Chair Powell expressed remarks that indicated further easing (rate cut) in late September: “Our main expectation is not at all that there will be a recession,’’ Powell said. “There are these risks, and we’re monitoring them very carefully and we’re conducting policy in a way that will address them.’’

Monthly Stock Market Summary & Weekly S&P 500 Update August 2019

8/3/2019

 
-August 30, 2019 Weekly Capital Market Update.  U.S. equity markets rallied on news both China & U.S. remain committed to some form of trade agreement, along with China indicating it would not retaliate against the most recent rounds of U.S. tariffs.  For the week, the Dow Jones Industrial Average led the major indices +3.02%, followed by the S&P 500 Index +2.79% and Nasdaq +2.72%. International market participant support was also in play on the week with Europeans buying U.S. fixed income and equities as a more attractive alternative to their negative interest environment.  Economic bears do not find comfort in figures where the U.S. consumer has turned in one of the all-time best quarters in Q2 2019; consumer spending grew at a 4.7% annualized clip, the second-best quarter of this cycle. Also,  JP Morgan came out this week saying it is time to buy U.S. Stocks where the bank highlighted three elements which may be a catalyst for a move higher by year end: restarted EU easing, a bigger than expected Fed rate cut, and improving technical indicators on signs the market has bottomed out.


-August 23, 2019 Weekly Capital Market Update. Investor fears of outright U.S.-China trade war moved further to reality after China retaliated with $75 billion tariffs on U.S. goods and resumed auto tariffs, which in turn, prompted Trump to tweet “Get out of China” to U.S. business leaders. Already in place was U.S. imposed tariffs on $250 billion of China imports, which will rise to 30% from 25% on Oct 1st; remaining $300 billion worth of goods will be 'tariffed' at 15% instead of 10% starting Sept 1st.  These events, along with growing geopolitical instability, drove markets lower for the fourth consecutive week: S&P 500 Index ‑1.44%, Dow Jones Industrial Average -0.99% and Nasdaq -1.83%. We are more concerned that heightened trade war rhetoric will dampen consumer confidence and spending, damaging the engine that has been powering economic growth (68% GDP = Consumer).  However, at this point, the U.S. consumer remains in excellent shape, posting the best five-month retail sales numbers since 2005. Further, Fed Chair Powell expressed "accommodative" remarks at the Jackson Hole Summit as it relates to the US-China Trade dispute: “The three weeks since our July meeting have been eventful...Based on our assessment of the implications of these developments, we will act as appropriate to sustain the expansion.”  Treasury yields have also compressed with a flight to safety given said trade concerns, Brexit, China vs. Hong Kong rights, potential of new elections in Italy, etc.
 

-August 16, 2019 Weekly Capital Market Update.  Largely spurred by 2/10 year treasury yield curve inversion and geopolitical tensions the markets posted another week of losses: the S&P 500 Index fell -1.03%, the Dow fell -1.53% and the Nasdaq lost -0.79%. With the 10-year Treasury yield slumping to 1.58%, leaving it even further below the 3-month T-bill rate at 1.95%, the NY Fed’s recession model (based on that yield spread) suggests the odds of an economic contraction have risen to 37%. Inversion is considered a reliable harbinger of recession in the U.S., within roughly the next 18 months. On the other hand, the S&P 500 is still up by close to 10% over the past 12 months. With the notable exception of 1980, every recession in the past 50 years was preceded or accompanied by a sizeable selloff in equities.  BofA’s investment team released the following: "Our official model has the probability of a recession over the next 12 months only pegged at about 20%, but our subjective call based on the slew of data and events leads us to believe it is closer to a 1-in-3 chance." Beyond the global and macro considerations, the fact remains is the world economy is still growing, albeit at a less healthy pace than in 2018. Insofar as U.S. businesses are pulling back some, jobs are plentiful, wages are picking up, credit is still easy and with cheaper oil then the U.S. consumers have money to spend. Starting through the major sectors of the economy, consumer spending has been a solid foundation for U.S.  economic growth. Indeed, consumer spending has increased by +3.9% over the past 12 months, with the most recent four months even better. Disposable income grew even faster, up +4.7%, bringing the savings rate up. This sets the foundation for our economic engine and if the Fed stays supportive while the consumer continues to spend, the near-term odds of tipping into recession is low.  Also, Warren Buffet is still buying and we wouldn’t want to bet against his track record.


-August 9, 2019 Weekly Capital Market Update. An uptick in trade war rhetoric continued to add downward pressure on equities: for the week, S&P 500 Index dipped -0.46%, Dow Jones Industrial Average fell -0.75% and the Nasdaq declined -0.56%.  China’s yuan currency tumbled Monday, breaching a level long described by market watchers as a “line in the sand” and feeding fears of an intensifying China-U.S. trade war. The U.S. economy is also showing signs of potential slowing as companies are indicating delayed plans for new investment; however, lower rates have been a bump for real estate and would make the cost of corporate borrowing more attractive. Viewed as a safe haven by investors in uncertain times, gold prices have now jumped above the psychological threshold of $1400 per ounce.  Likewise, the flight of capital to safer U.S. Treasuries moved the yield on the 10-year Bond to a three-year low of 1.71%. The spread between three-month bills and ten-year Treasuries has widened to minus 32 basis points. A yield curve inversion has preceded every recession for the last 50 years. However, the degree and duration of the inversion needs to extend much further to glean anything meaningful.


-August 2, 2019 Weekly Capital Market Update. The markets declined on fears of further U.S. economy damage from escalating trade tariffs with China after President Trump voiced frustration over trade negotiations by threatened to implement a 10% tariff on September 1st for the remaining $300 billion of Chinese exports not already subject to tariffs.  In response, S&P 500 Index fell -3.10%, Dow Jones Industrial Average -2.60% and Nasdaq declined -3.92% on the week. On Wednesday, the widely anticipated Federal Reserve cut to effect, lowering the fed funds rate by -25 basis points.  Fed Chair Powell also added some backdrop forward looking statements: “I said it’s not the beginning of a long series of rate cuts.  I didn’t say it’s just one or anything like that.”  Over 75% of companies in the S&P 500 have reported earnings and of these, 76% exceeded analysts’ modest expectations by more than 6%.  

Monthly Stock Market Summary & Weekly S&P 500 Update July 2019

7/6/2019

 
-July 26, 2019 Weekly Capital Market Update. For the week, the S&P 500 Index +1.65%, Dow Jones Industrial Average +0.14% and the Nasdaq’s finished +2.26%. With about a quarter of the S&P 500 companies ($SPX) having reported 2Q earnings, 77% have beaten analyst EPS estimates to date; which is above the 5-year average of 72%.  However, $SPX is reporting revenue growth of 4.0% in Q2 2019, which would be the lowest revenue growth for the index since Q3 2016. This week the International Monetary Fund (IMF) revised growth projections by increasing GDP in the U.S. from 2.3% to 2.6%.  As for China-U.S. trade negotiations, talks are expected to resume next month, and in a sign of good faith, China is resuming imports of certain U.S. products without imposing tariffs. The UK’s new Prime Minister, Boris Johnson, made his intentions clear to implement Brexit by the October 31 deadline - with or without an agreement. 
 

-July 20, 2019 Weekly Capital Market Update.  For the week, S&P 500 returned -1.23%, the Nasdaq lost -1.18%, and the Dow Jones Industrial Average declined -0.65%.  Heading into earning season, analysts have a downtrodden expectation of -3% decline in earnings. Also, the expected rate cut by the Fed Reserve had already been baked into market valuations with last week's gains.  
​


-July 12, 2019 Weekly Capital Market Update. The markets reacted positively to comments by Fed Chair Powell along with Wednesday’s release of June Minutes which indicated that the Fed would be willing to cut rates if risks and uncertainties “continue to weigh on the economic outlook.”  Many interpret those comments - along with "The bottom line for me is that the uncertainties around global growth and trade continue to weigh on the outlook.. In addition, inflation continues to be muted. And those things are still in place” - to suggest a likely -0.25% rate reduction in the Fed funds rate at the meeting slated at month’s end.  Accordingly, Dow Jones Industrial Average led all market indices gaining +1.52% followed by Nasdaq +1.01%, and S&P 500 Index +0.78%.  This month marks the longest economic expansion in U.S. history, surpassing the previous record holder, which was Mar 1991-Mar 2001. Also, there are positive historical guideposts in place: when stocks have a good first half (and they surely have), then they are 60% more likely to finish the year strongly as well.  Second-quarter earnings season opened with a few early reporters with Pepsi (PEP) and Delta (DAL) beating earnings estimates. However, eyes are now focused on next week where there will be 50+ companies reporting, including most major banks; this will offer a better insight on the overall directional health of our economy.  


-July 5, 2019 Weekly Capital Market Update. On the holiday truncated trading week the US equity markets closed near their record highs with the S&P 500 +1.7%, the Dow Jones +1.3% and the Nasdaq finishing +1.9%. The positive index returns were partly fueled by news that the U.S. and China agreed to suspend new tariffs and resume negotiations. There is also plenty to be encouraged by in the job market with U.S. labor force participation ticking higher last month with yearly average monthly growth being 172k; the current pace of job growth is also more than sufficient to push the unemployment rate below 3.5% by the end of 2019. The strong rebound in June’s job growth bodes well for consumer spending and GDP growth ahead.  The Fed will continue to play the lead role for driving investor expectations while the central bank's responsive policy approach should breathe further life into the current equity valuation expansion. Recall, first quarter 2019 (1QFY19) earnings were expected to decline -2%, but there was actual growth of +1.6%, which is consistent with the “upside surprise” around quarterly SP 500 earnings.  For the current second quarter 2019 (Q2FY19) earnings, the expectation is +0.3% increase, but the “actual" Q2FY19 results could be upside surprise again of around +3% range.

Monthly Stock Market Summary & Weekly S&P 500 Update June 2019

6/1/2019

 
-June 28, 2019 Weekly Capital Market Update. The S&P paused and finished flat but on a negative tone for the week yet remains up 17+% for the year. Here is the weekly equity index performance scorecard:  The S&P 500 Index declined -0.31% followed by Nasdaq ‑0.32% and Dow Jones Industrial Average -0.45%.  This lackluster week is emblematic of the market awaiting news from Presidents Trump and Xi Saturday meeting in Japan. Turning to the corporate health-card, estimated earnings decline for the S&P 500 is -2.6%. If -2.6% is the actual decline for the quarter, it will mark the first time the index has reported two straight quarters of year-over-year declines in earnings since Q1 2016 and Q2 2016. However, so far of the 20 of the companies in the S&P 500 reporting actual results for the quarter, 17 companies have reported a positive EPS surprise and 14 companies have reported a positive revenue surprise. With small business optimism still on the rise, job openings still high, an accommodative Fed system with financial conditions loosening - and with no significant tariff earnings pain yet to materialize – then, perhaps the valuation bar should be set fairly high given the potential for multiple rate cuts this year.


-June 21, 2019 Weekly Capital Market Update. The U.S. equity market rallied for the third consecutive week on news that Presidents Trump and Xi would meet at next week’s G20 summit in Japan, along with the Fed’s new dovish tone toward moving interest rates lower. For instance, the Fed removed the term “patient” in its outlook and added “act, as appropriate, to sustain the expansion.”  For the week, the Nasdaq led all indices with gains of +3.01%, followed by the Dow Jones +2.41% and S&P 500 Index +2.20%. Again, we find that the Fed is dictating market sentiment and this bias has overcome tariff concerns; most investment strategists don’t foresee any significant trade developments before next weekend’s G20 summit. 


-June 14, 2019 Weekly Capital Market Update. Domestic stocks edged higher on the week with no significant news on tariffs or corporate results (quiet period): S&P 500 Index +0.47%, Nasdaq gained +0.70% and the Dow Jones Industrial Average +0.41%.  However, saber-rattling emerged as a geopolitical risk with allegations surrounding Iran’s active role in terrorizing oil tankers. While the economy remains stable, analysts forecast second quarter GDP to be down to the +1% range, while investors will look to upcoming commentary and guidance on the tariff impact from corporate heads during earnings calls next week (Tuesday 205 companies report); estimated earnings decline for the S&P 500 is -2.5%.  Also, the markets are also awaiting news from the both the June 18-19 scheduled Fed meeting (probability July rate cut 83%) and later in the month, the G20 meeting - Trump indicated he intends to have a powwow with Xi of China.


-June 7, 2019 Weekly Capital Market Update. After four weeks of consecutive market losses, this week, Federal Reserve Chairman Jerome Powell promised to “closely monitoring the implications of these [tariff] developments for the U.S. economic outlook and, as always, we will act as appropriate to sustain the expansion, with a strong labor market and inflation near our symmetric 2 percent objective.”  We have often written that “don’t fight the Fed” and even in the throws of potential tariff disruption there is an overwhelming bias toward an accommodating Federal Reserve and cheap money.  Accordingly, the Dow Jones Industrial led all indices with a +4.71% gain followed by the S&P 500 Index +4.41% and the Nasdaq +3.88%. The market rejoiced the potential of cheaper money (again) in the face of indication of potential hiring slowdown and slowing wage growth (to 3.1%) amid trade tensions with only 75,000 jobs added in May. Also, the World Bank recently revised 2019 estimates of global economic growth from 2.9% from 2.6%. While the S&P 500 companies remain in the quite period before the impending 2nd quarter earnings, the EPS estimates for Q2 has declined by -6.6% over the past 12 months, and by -2.2% since the 1st quarter.


-June 1, 2019 Weekly Capital Market Update.  The markets like order and transparency, yet the expanded use of tariffs has caused disorder.  First, there was the breakdown in U.S. and China negotiations, then tariff threats on European and Japanese autos and now the latest threat of tariffs on imports from Mexico, our major trading partner; this reinforces trepidation about whether tariffs will ultimately undermine global economic growth.  Indeed, President Trump announced plans to impose tariffs on all imports from Mexico in an effort to stop migrants crossing into the U.S.  The tariff, effective June 10th, would begin at 5% and escalate at 5% intervals to a maximum of 25% in October.  The markets responded negatively with a 4th week where all major U.S. equity indices declined: S&P 500 Index -2.62%, Nasdaq -2.41% and Dow Jones Industrial Average -3.01%.

Monthly Stock Market Summary & Weekly S&P 500 Update May 2019

5/4/2019

 
-May 24, 2019 Weekly Capital Market Update.  U.S. equity markets were marked by a third week of losses on the heels of ongoing escalation with China-U.S. trade tariffs.  The negative earnings impact is worrying U.S. companies; also geopolitical risk has spiked with the U.S.-Iran tensions in the Persian Gulf. Thus, the Nasdaq fell -2.29%, S&P 500 Index dropped -1.17% and the Dow Jones Industrial lost -0.69%. Mixed corporate earnings results from retailers contributed to the negative market tone. In terms of sectors, energy stocks performed worst within the S&P 500 Index, as oil prices suffered most with largest declines. In turn, defensive utilities were the stand out performer by banking record gains. Trade volume was rather low on the week and this may indicate that many investors remain on the sidelines and the markets’ current low expectations for a quick tariff resolution suggest that positive developments on trade could create a rebound in equities. Indeed, the technical pattern of this selloff feels more like a buyers’ strike than outright institutional selling. On the economic front, new home sales volume turned positive year-over-year and may yet finally contribute (positively) to GDP in 2019.
 

-May 18, 2019 Weekly Capital Market Update. Though markets rallied in the second half of the week, the U.S. equities could not overcome the sharp early-week losses: S&P 500 -0.76%, Dow Jones -0.69% and Nasdaq -1.27%. There is no clarity at this time as to resumption of U.S.-China tariff trade negotiations and equities values struggle with uncertainty (so far the depth of this pullback is measured at -4.5%). While the tariff toll tallied $4.4 billion per month in 2018, the tariff pales in comparison to the total U.S. consumer spending power of $14 trillion.


-May 10, 2019 Weekly Capital Market Update. The U.S. equity markets retrenched past gains after trade tensions unexpectedly escalated: S&P 500® Index -2.18%, Nasdaq declined -3.03% and Dow Jones Industrial Average -2.12%. U.S. trade negotiators reportedly told President Trump that China was backing away from some key commitments to a developing trade agreement and by Sunday, President Trump tweeted that trade negotiations with China were moving too slowly; he then later announced a tariff increase (from 10% to 25%) on $200 billion of Chinese imports effective Sunday.  Both parties hit the negotiation table again until late Thursday and when an agreement failed to materialized, the U.S. initiated a 25% tariff on an additional $320 billion of imports from China. Trump is leveraging the strength of the U.S. economy to effectuate necessary systemic changes of fairness with China business and trade.  From our prospective, the long-term potential benefits outweigh what appears to be current market stress and the market is simply revaluing both the lower likelihood of fast timetable and perhaps a reduced level of success (trade terms).  What is also apparent is the first round of tariffs did not negatively impact U.S. GDP (Q1) and therefore this has emboldened the U.S. trade negotiations team.  Finally, and again from our view, should this trade tariff exchange escalate, the markets would anticipate compensation by the Fed with a rate cut – this would likely offset a good amount of the tariff disruption costs overall. This equation is evident given at least on two trade days last week we had the markets down significantly, then a sizable recovery in the last hour of trading (indicating institutional “smart” money buying the dip).


-May 3, 2019 Weekly Capital Market Update. For the week, U.S. equity markets finished mixed, with the Nasdaq +0.22%, S&P 500 Index +0.20% and the Dow Jones Industrial -0.14%. The market continues to absorb the benefits of a Goldilocks economy, which is not too hot, yet not too cold – that usually is the ideal ingredients for growth and no Fed rate increases. The drivers of the market rally has been: 1) positive earnings surprises (76% of S&P 500 companies have reported a positive EPS surprise), 2) low inflation (1.6%), 3) accommodating Fed (no prospective rate hikes), 4) Q1 productivity grew at a hefty 3.6% pace, versus the 1.3% clip in Q4 and 5) near full employment economy (unemployment at 3.6%).

Monthly Stock Market Summery & Weekly S&P 500 Update April 2019

4/1/2019

 
-April 26, 2019 Weekly Capital Market Update. The S&P 500 Index reached a record high this week as the market rebound continues: the S&P 500 rose +1.20% while the Dow Jones Industrial Average dropped -0.06%. First quarter (1Q) 2019 real GDP surprised to the upside at 3.2% (2.3% expected), but was driven more by Inventories and trade as opposed to the overall corporate earnings growth. This explains how GDP can rise while corporate earnings are depressed. While the S&P 500 is reporting its first year-over-year decline (-2.8%) in quarterly earnings since Q2 2016 Mr. Market remains focused on the glass half full, such as  77% of S&P 500 companies have beaten EPS estimates for Q1 to date.  Approximately 38% of companies in the S&P 500 have reported quarterly results and the market continues to embrace that earnings, though down, are better than expectations, or just falling -2.8% vs. the projection of -4.2%.


-April 19, 2019 Weekly Capital Market Update. The S&P 500 returned +0.60% on the week and sits less than 1% off the highs, showing the broad equity market index continues to face resistance at the prior highs.  Not only is the S&P 500 still fighting resistance these past weeks, but the index has also has been marked by relatively calm volume and volatility. It is obviously apparent that from a technical standpoint the market brushed off the much-hyped Mueller report as inconsequential.  As for first quarter earnings, the S&P 500 is reporting revenue growth of +5.0% in Q1 2019, which would be the lowest revenue growth for the index since Q4 2016; earnings are on a pace with about a -4% decline. The forward 12-month P/E ratio for the S&P 500 is 16.7. This P/E ratio is above the 5-year average (16.4) and above the 10-year average (14.7).


-April 12, 2019 Weekly Capital Market Update. The S&P 500 reached an important milestone on Friday when the Index crossed 2900 for the first time since last October; the broad market index finished +0.51% on the week. The equity markets were supported by a positive start to earnings season and this may bode well for corporate commentaries on expectations for the remainder of 2019.  Additional market stability stemmed from the FOMC minutes where Fed officials largely approved a "patient" approach to monetary policy going forward.


-April 5, 2019 Weekly Capital Market Update. China’s release of strong economic data on Sunday set the stage for across-the-board market for the week, which was also aided by Monday’s upbeat comments from U.S. and Chinese officials on the progress of trade negotiations: S&P 500 Index +2.06%, the Dow Jones Industrial Average +1.91% and the Nasdaq 2.71%. The S&P 500 is now only 1.5% off its all-time-high from August of last year.  Next week brings first quarter earnings season where financials are the first early indicators with JPMorgan (NYSE:JPM) and Wells Fargo (NYSE:WFC). Estimated earnings are expected to decline for the S&P 500 by -4.2%; this would mark the first year-over-year decline in earnings for the index since Q2 2016.

Monthly Stock Market Summary & Weekly S&P 500 Update March 2019

3/2/2019

 
-March 29, 2019 Weekly Capital Market Update. For the week, all U.S. equity markets gained ground on resumed trade talks with China and ECB’s Draghi’s easy credit schemes for the EU: S&P 500 +1.20%, Dow Jones Industrial +1.67% and Nasdaq +1.13%. The markets also reacted favorably to the National Economic Council Director comments by Larry Kudlow suggesting that the FOMC should pursue an immediate half percent rate cut to protect economic expansion. The markets celebrated the well-received Lyft IPO on Friday - Lyft raised the offering price from the mid-60s to $72 and the stock then closed up +8.74% on Friday. In Europe, the future of Brexit remains uncertain as Prime Minister May’s latest attempt at Parliamentary approval for Britain’s withdrawal agreement with the EU failed.  Recent equity market trading has moved toward a tighter range (S&P 500's trade range was 2,800-2835) on moderated volume and this seemingly indicates the market is waiting for a new directional catalyst – perhaps when earnings season begins in the 2nd week of April this will bring data dependent direction.  Some weeks ago we halted our incremental de-risking of portfolios as we believe the current portfolio allocation mix is now more properly aligned with the current valuations, fundamentals and risks.  


-March 22, 2019 Weekly Capital Market Update. The U.S. equity markets gave back some of last week’s gains with the S&P 500 -0.77%, the Dow Jones Industrial -1.34% and Nasdaq -0.60% - Friday brought red to this week’s index performances.  This leaves the S&P with a gain of about 12% for the year, but still 4-5% from the all-time highs from last year. Equity traders were rattled on Friday by the first trigger of an inversion of the treasury curve since 2007; 10-year and three-month Treasuries , which on Friday turned negative, or to -0.196 percentage points.  Inversion is considered a reliable harbinger of recession in the U.S., within roughly the next 18 months.  The Fed meeting yielded no change in policy and the updated guidance from the FOMC indicated no potential rate hikes for 2019, and perhaps "only" one hike for 2020.  The 10-0 decision held the target range of the federal funds rate steady at 2.25 percent to 2.5 percent.  Fed Chair Powell has certainly flipped his stance in a short period of just 4-months from 4 rate hikes to now no hikes in 2019, and the stock market is interpreting this sharp ‘dovish’ policy change as a Fed that is now 100% backing Mr. Market.  The Fed also downgraded its economic assessment: “Economic activity slowed from its solid rate.” Powell expressed that the Fed will remain patient and watching data, but (at this time) is not seeing any data to do anything and if they do see anything, then they will act accordingly. “It may be some time before the outlook for jobs and inflation calls clearly for a change in policy.” The FOMC also chose to reduce its balance sheet to $3.5 trillion with the plan of selling about $600 billion, with the winddown scheduled to end this September. 4th quarter earnings season is over, and unless we get a market moving headline like on trade, or new eyepopping economic data indicators, then we don’t see any significant catalyst on the horizon to move the market near-term. Until then, we have Trump news of no "indictment" in the Mueller report, which should bode positive for the markets early next week - Trump has a clear pro-business and pro-capitalism policy stance.


-March 15, 2019 Weekly Capital Market Update. The U.S. equity markets recovered last week’s losses with the S&P 500 +2.89%, Dow Jones Industrials +1.57% and Nasdaq +3.78% on the week. While U.S.-China trade discussions continued there were no significant developments other than an expected agreement in April, along with some new rights for foreign companies operating in China. Recall, the Fed has paused its rate hikes and may not even hike in 2019 since economic fundamentals have just begun to show cracks. It started with housing, then job growth for February, and now it is jobless claims. Jobless claims rose by 6,000 last week after a long stretch of falling numbers.  However, the equity markets appear to be indicating a preference toward accommodating Fed over the potential of a mild recession. The global economy has hits its weakest spell since the financial crisis; GDP tracker puts world growth at 2.1% on a quarter-on-quarter annualized basis, down from about 4% in the middle of last year. Moreover, full-year earnings per share forecasts for S&P 500 companies are likely to further fall, perhaps between -4% and -5%, which could put added pressure on the index. "Earnings revision breadth has been some of the worst we have ever witnessed with both sales and margin guidance coming down across all sectors," Morgan Stanley's chief U.S. equity strategist, Michael Wilson, says. "It also means there probably isn't as much slack in the economy as many investors think and as depicted by the cost pressures now evident."

Picture
-March 8, 2019 Weekly Capital Market Update.  U.S. equity markets were hit with the first four-day loss, along with the largest weekly loss for the year: S&P 500 Index -2.16%, Dow Jones Industrial -2.21% and Nasdaq -2.46%. Concerns about softer global growth and fading hopes of a U.S.-China trade agreement sent share prices lower. Also, concerns of potential economic headwinds on the home front were sparked by February’s jobs report, badly missing expectations as the economy added only 20,000 non-farm jobs while economists expected 175,000.  We have emphasized a number of times that it is our view that equity valuations have been getting ahead of themselves and were not aligned with current (& forecasted) economic trends, both domestically and abroad. In fact, we had telegraphed a hedge last week on short exposure to real estate, and are now sharing another hedge placed (to offset long position exposure) on Monday in gold; we had added new positions in symbol GLD before the market weakness transpired later in the week.  We have also been transparent in our view of "feathering" down equity positions as valuations moved ahead of fundamentals and have thoughtfully pursued an incremental de-risking of portfolios. However, should fundamentals elevate or valuations decline to a point we perceive stocks trade at  below fair-value, we would look to increase our equity exposure once again.


-March 1, 2019 Weekly Capital Market Update. The S&P 500 closed above 2,800 for the first time in nearly 4-months on trade optimism; negotiations between the U.S. and China may conclude as soon as in two weeks. The Nasdaq led the indices this week with +0.90% gain followed by S&P 500 +0.40%, while the Dow Jones Industrial Average finished -0.02%. On the economic front, manufacturers grew at slowest pace since Trump's election with ISM index falling to 54.2% in February. Consumer sentiment also slipped in late February according to The University of Michigan; index declined to 93.8 in late February from 95.5 earlier in the month. Another economic headwind was marked by a repeated patch of really rough data on the U.S. real estate market. The new housing data from December has just been released, and shows a clear negative trend for housing where starts dropped -11.2% in the month, and overall, the market saw the worst price growth since 2014. Meanwhile, Atlanta Fed President Raphael Bostic, speaking at the National Association for Business Economics conference in Washington, D.C., said he still expects the central bank to raise interest rates once this year. We still believe that equity valuations are overreaching based on fundamentals and therefore we added a new position on Friday morning as a hedge against some of our long holdings.  We purchased a real estate inverse exchange traded fund (symbol: DRV) that is levered, with about 0.5%-1% allocations based on different client profiles. This ETF had hit a lofty net asset value (NAV) of about 6,300 back in 2008 due to the financial crises, but was still up at 1,287 end of 2009 and even as high as 361 at end of 2010.  It is now trading at its low of 7.79 NAV and this is where we started entering our positions. DRV is a 3x inverse that has lost big time 9 out of past 10 years. The thesis is if we take a small position with the ETF already down about -30% year-to-date, then the downside exposure is likely limited to about minus 10-to-15% range while the asymmetrical upside is astronomical. For example if it just goes back up to where the market was in recovery back in 2010 at 361, then that is a 52x return.. and if it markets return to losses experienced in the last financial crises of 2008, then that is a 750x return.  Back in 2008 we used a financial ETF to be inversely exposed to financial sector  with about a 1% allocation and that 1% allocation delivered a meaningful positive return attribute to help offset other losses in long positions that year. We contend real estate valuations are currently a weak link and can be crushed should the clouds on the horizon materialize as problematic; also this is a good entry point to hedge market exposure in many of our client portfolios that fit this degree of risk tolerance acceptability.
<<Previous
Forward>>

    Follow us on Twitter: @MontecitoCapMgt

    Monthly Archives:
              

    June 2022
    May 2022
    April 2022
    March 2022
    February 2022
    January 2022
    December 2021
    November 2021
    October 2021
    September 2021
    August 2021
    July 2021
    June 2021
    May 2021
    April 2021
    March 2021
    February 2021
    January 2021
    December 2020
    November 2020
    October 2020
    September 2020
    August 2020
    July 2020
    June 2020
    May 2020
    April 2020
    March 2020
    February 2020
    January 2020
    December 2019
    November 2019
    October 2019
    September 2019
    August 2019
    July 2019
    June 2019
    May 2019
    April 2019
    March 2019
    February 2019
    January 2019
    December 2018
    November 2018
    October 2018
    September 2018
    August 2018
    July 2018
    June 2018
    May 2018
    April 2018
    March 2018
    February 2018
    January 2018
    December 2017
    November 2017
    October 2017
    September 2017
    August 2017
    July 2017
    June 2017
    May 2017
    April 2017
    March 2017
    February 2017
    January 2017
    December 2016
    November 2016
    October 2016
    August 2016
    July 2016
    June 2016
    May 2016
    April 2016
    March 2016
    February 2016
    January 2016
    December 2015
    November 2015
    October 2015
    September 2015
    August 2015
    July 2015

    Categories

    All

    RSS Feed

We Would Love to Have You Visit Soon!


Hours

M-F: 6:30am-6pm

Telephone

1-805-965-7955

Email

contactus@mcapitalmgt.com