-March 29, 2019 Weekly Capital Market Update. For the week, all U.S. equity markets gained ground on resumed trade talks with China and ECB’s Draghi’s easy credit schemes for the EU: S&P 500 +1.20%, Dow Jones Industrial +1.67% and Nasdaq +1.13%. The markets also reacted favorably to the National Economic Council Director comments by Larry Kudlow suggesting that the FOMC should pursue an immediate half percent rate cut to protect economic expansion. The markets celebrated the well-received Lyft IPO on Friday - Lyft raised the offering price from the mid-60s to $72 and the stock then closed up +8.74% on Friday. In Europe, the future of Brexit remains uncertain as Prime Minister May’s latest attempt at Parliamentary approval for Britain’s withdrawal agreement with the EU failed. Recent equity market trading has moved toward a tighter range (S&P 500's trade range was 2,800-2835) on moderated volume and this seemingly indicates the market is waiting for a new directional catalyst – perhaps when earnings season begins in the 2nd week of April this will bring data dependent direction. Some weeks ago we halted our incremental de-risking of portfolios as we believe the current portfolio allocation mix is now more properly aligned with the current valuations, fundamentals and risks.
-March 22, 2019 Weekly Capital Market Update. The U.S. equity markets gave back some of last week’s gains with the S&P 500 -0.77%, the Dow Jones Industrial -1.34% and Nasdaq -0.60% - Friday brought red to this week’s index performances. This leaves the S&P with a gain of about 12% for the year, but still 4-5% from the all-time highs from last year. Equity traders were rattled on Friday by the first trigger of an inversion of the treasury curve since 2007; 10-year and three-month Treasuries , which on Friday turned negative, or to -0.196 percentage points. Inversion is considered a reliable harbinger of recession in the U.S., within roughly the next 18 months. The Fed meeting yielded no change in policy and the updated guidance from the FOMC indicated no potential rate hikes for 2019, and perhaps "only" one hike for 2020. The 10-0 decision held the target range of the federal funds rate steady at 2.25 percent to 2.5 percent. Fed Chair Powell has certainly flipped his stance in a short period of just 4-months from 4 rate hikes to now no hikes in 2019, and the stock market is interpreting this sharp ‘dovish’ policy change as a Fed that is now 100% backing Mr. Market. The Fed also downgraded its economic assessment: “Economic activity slowed from its solid rate.” Powell expressed that the Fed will remain patient and watching data, but (at this time) is not seeing any data to do anything and if they do see anything, then they will act accordingly. “It may be some time before the outlook for jobs and inflation calls clearly for a change in policy.” The FOMC also chose to reduce its balance sheet to $3.5 trillion with the plan of selling about $600 billion, with the winddown scheduled to end this September. 4th quarter earnings season is over, and unless we get a market moving headline like on trade, or new eyepopping economic data indicators, then we don’t see any significant catalyst on the horizon to move the market near-term. Until then, we have Trump news of no "indictment" in the Mueller report, which should bode positive for the markets early next week - Trump has a clear pro-business and pro-capitalism policy stance.
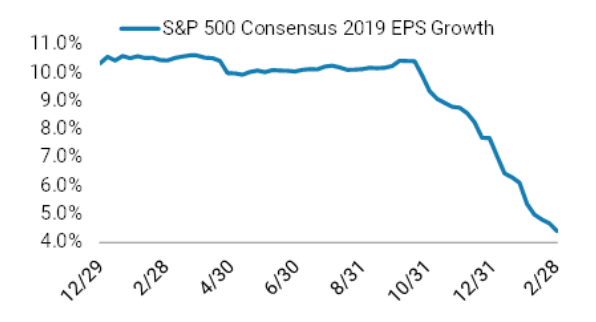
-March 15, 2019 Weekly Capital Market Update. The U.S. equity markets recovered last week’s losses with the S&P 500 +2.89%, Dow Jones Industrials +1.57% and Nasdaq +3.78% on the week. While U.S.-China trade discussions continued there were no significant developments other than an expected agreement in April, along with some new rights for foreign companies operating in China. Recall, the Fed has paused its rate hikes and may not even hike in 2019 since economic fundamentals have just begun to show cracks. It started with housing, then job growth for February, and now it is jobless claims. Jobless claims rose by 6,000 last week after a long stretch of falling numbers. However, the equity markets appear to be indicating a preference toward accommodating Fed over the potential of a mild recession. The global economy has hits its weakest spell since the financial crisis; GDP tracker puts world growth at 2.1% on a quarter-on-quarter annualized basis, down from about 4% in the middle of last year. Moreover, full-year earnings per share forecasts for S&P 500 companies are likely to further fall, perhaps between -4% and -5%, which could put added pressure on the index. "Earnings revision breadth has been some of the worst we have ever witnessed with both sales and margin guidance coming down across all sectors," Morgan Stanley's chief U.S. equity strategist, Michael Wilson, says. "It also means there probably isn't as much slack in the economy as many investors think and as depicted by the cost pressures now evident."
-March 22, 2019 Weekly Capital Market Update. The U.S. equity markets gave back some of last week’s gains with the S&P 500 -0.77%, the Dow Jones Industrial -1.34% and Nasdaq -0.60% - Friday brought red to this week’s index performances. This leaves the S&P with a gain of about 12% for the year, but still 4-5% from the all-time highs from last year. Equity traders were rattled on Friday by the first trigger of an inversion of the treasury curve since 2007; 10-year and three-month Treasuries , which on Friday turned negative, or to -0.196 percentage points. Inversion is considered a reliable harbinger of recession in the U.S., within roughly the next 18 months. The Fed meeting yielded no change in policy and the updated guidance from the FOMC indicated no potential rate hikes for 2019, and perhaps "only" one hike for 2020. The 10-0 decision held the target range of the federal funds rate steady at 2.25 percent to 2.5 percent. Fed Chair Powell has certainly flipped his stance in a short period of just 4-months from 4 rate hikes to now no hikes in 2019, and the stock market is interpreting this sharp ‘dovish’ policy change as a Fed that is now 100% backing Mr. Market. The Fed also downgraded its economic assessment: “Economic activity slowed from its solid rate.” Powell expressed that the Fed will remain patient and watching data, but (at this time) is not seeing any data to do anything and if they do see anything, then they will act accordingly. “It may be some time before the outlook for jobs and inflation calls clearly for a change in policy.” The FOMC also chose to reduce its balance sheet to $3.5 trillion with the plan of selling about $600 billion, with the winddown scheduled to end this September. 4th quarter earnings season is over, and unless we get a market moving headline like on trade, or new eyepopping economic data indicators, then we don’t see any significant catalyst on the horizon to move the market near-term. Until then, we have Trump news of no "indictment" in the Mueller report, which should bode positive for the markets early next week - Trump has a clear pro-business and pro-capitalism policy stance.
-March 15, 2019 Weekly Capital Market Update. The U.S. equity markets recovered last week’s losses with the S&P 500 +2.89%, Dow Jones Industrials +1.57% and Nasdaq +3.78% on the week. While U.S.-China trade discussions continued there were no significant developments other than an expected agreement in April, along with some new rights for foreign companies operating in China. Recall, the Fed has paused its rate hikes and may not even hike in 2019 since economic fundamentals have just begun to show cracks. It started with housing, then job growth for February, and now it is jobless claims. Jobless claims rose by 6,000 last week after a long stretch of falling numbers. However, the equity markets appear to be indicating a preference toward accommodating Fed over the potential of a mild recession. The global economy has hits its weakest spell since the financial crisis; GDP tracker puts world growth at 2.1% on a quarter-on-quarter annualized basis, down from about 4% in the middle of last year. Moreover, full-year earnings per share forecasts for S&P 500 companies are likely to further fall, perhaps between -4% and -5%, which could put added pressure on the index. "Earnings revision breadth has been some of the worst we have ever witnessed with both sales and margin guidance coming down across all sectors," Morgan Stanley's chief U.S. equity strategist, Michael Wilson, says. "It also means there probably isn't as much slack in the economy as many investors think and as depicted by the cost pressures now evident."
-March 8, 2019 Weekly Capital Market Update. U.S. equity markets were hit with the first four-day loss, along with the largest weekly loss for the year: S&P 500 Index -2.16%, Dow Jones Industrial -2.21% and Nasdaq -2.46%. Concerns about softer global growth and fading hopes of a U.S.-China trade agreement sent share prices lower. Also, concerns of potential economic headwinds on the home front were sparked by February’s jobs report, badly missing expectations as the economy added only 20,000 non-farm jobs while economists expected 175,000. We have emphasized a number of times that it is our view that equity valuations have been getting ahead of themselves and were not aligned with current (& forecasted) economic trends, both domestically and abroad. In fact, we had telegraphed a hedge last week on short exposure to real estate, and are now sharing another hedge placed (to offset long position exposure) on Monday in gold; we had added new positions in symbol GLD before the market weakness transpired later in the week. We have also been transparent in our view of "feathering" down equity positions as valuations moved ahead of fundamentals and have thoughtfully pursued an incremental de-risking of portfolios. However, should fundamentals elevate or valuations decline to a point we perceive stocks trade at below fair-value, we would look to increase our equity exposure once again.
-March 1, 2019 Weekly Capital Market Update. The S&P 500 closed above 2,800 for the first time in nearly 4-months on trade optimism; negotiations between the U.S. and China may conclude as soon as in two weeks. The Nasdaq led the indices this week with +0.90% gain followed by S&P 500 +0.40%, while the Dow Jones Industrial Average finished -0.02%. On the economic front, manufacturers grew at slowest pace since Trump's election with ISM index falling to 54.2% in February. Consumer sentiment also slipped in late February according to The University of Michigan; index declined to 93.8 in late February from 95.5 earlier in the month. Another economic headwind was marked by a repeated patch of really rough data on the U.S. real estate market. The new housing data from December has just been released, and shows a clear negative trend for housing where starts dropped -11.2% in the month, and overall, the market saw the worst price growth since 2014. Meanwhile, Atlanta Fed President Raphael Bostic, speaking at the National Association for Business Economics conference in Washington, D.C., said he still expects the central bank to raise interest rates once this year. We still believe that equity valuations are overreaching based on fundamentals and therefore we added a new position on Friday morning as a hedge against some of our long holdings. We purchased a real estate inverse exchange traded fund (symbol: DRV) that is levered, with about 0.5%-1% allocations based on different client profiles. This ETF had hit a lofty net asset value (NAV) of about 6,300 back in 2008 due to the financial crises, but was still up at 1,287 end of 2009 and even as high as 361 at end of 2010. It is now trading at its low of 7.79 NAV and this is where we started entering our positions. DRV is a 3x inverse that has lost big time 9 out of past 10 years. The thesis is if we take a small position with the ETF already down about -30% year-to-date, then the downside exposure is likely limited to about minus 10-to-15% range while the asymmetrical upside is astronomical. For example if it just goes back up to where the market was in recovery back in 2010 at 361, then that is a 52x return.. and if it markets return to losses experienced in the last financial crises of 2008, then that is a 750x return. Back in 2008 we used a financial ETF to be inversely exposed to financial sector with about a 1% allocation and that 1% allocation delivered a meaningful positive return attribute to help offset other losses in long positions that year. We contend real estate valuations are currently a weak link and can be crushed should the clouds on the horizon materialize as problematic; also this is a good entry point to hedge market exposure in many of our client portfolios that fit this degree of risk tolerance acceptability.
-March 1, 2019 Weekly Capital Market Update. The S&P 500 closed above 2,800 for the first time in nearly 4-months on trade optimism; negotiations between the U.S. and China may conclude as soon as in two weeks. The Nasdaq led the indices this week with +0.90% gain followed by S&P 500 +0.40%, while the Dow Jones Industrial Average finished -0.02%. On the economic front, manufacturers grew at slowest pace since Trump's election with ISM index falling to 54.2% in February. Consumer sentiment also slipped in late February according to The University of Michigan; index declined to 93.8 in late February from 95.5 earlier in the month. Another economic headwind was marked by a repeated patch of really rough data on the U.S. real estate market. The new housing data from December has just been released, and shows a clear negative trend for housing where starts dropped -11.2% in the month, and overall, the market saw the worst price growth since 2014. Meanwhile, Atlanta Fed President Raphael Bostic, speaking at the National Association for Business Economics conference in Washington, D.C., said he still expects the central bank to raise interest rates once this year. We still believe that equity valuations are overreaching based on fundamentals and therefore we added a new position on Friday morning as a hedge against some of our long holdings. We purchased a real estate inverse exchange traded fund (symbol: DRV) that is levered, with about 0.5%-1% allocations based on different client profiles. This ETF had hit a lofty net asset value (NAV) of about 6,300 back in 2008 due to the financial crises, but was still up at 1,287 end of 2009 and even as high as 361 at end of 2010. It is now trading at its low of 7.79 NAV and this is where we started entering our positions. DRV is a 3x inverse that has lost big time 9 out of past 10 years. The thesis is if we take a small position with the ETF already down about -30% year-to-date, then the downside exposure is likely limited to about minus 10-to-15% range while the asymmetrical upside is astronomical. For example if it just goes back up to where the market was in recovery back in 2010 at 361, then that is a 52x return.. and if it markets return to losses experienced in the last financial crises of 2008, then that is a 750x return. Back in 2008 we used a financial ETF to be inversely exposed to financial sector with about a 1% allocation and that 1% allocation delivered a meaningful positive return attribute to help offset other losses in long positions that year. We contend real estate valuations are currently a weak link and can be crushed should the clouds on the horizon materialize as problematic; also this is a good entry point to hedge market exposure in many of our client portfolios that fit this degree of risk tolerance acceptability.