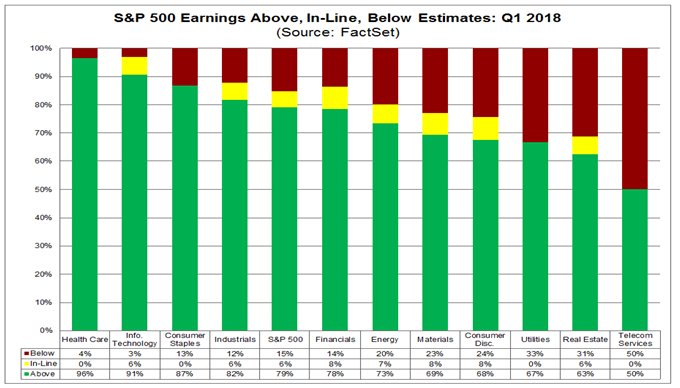
-April 13, 2018 Weekly Market Update. The U.S. equity markets recovered some ground this week with the S&P 500, Dow Jones & Nasdaq returning +2.04%, +1.80% and +2.77%, respectively, on positive trade statements by China, Facebook CEO Zuckerberg’s well-handled congressional testimony and positive corporate earnings developments. Case in point, China’s Xi Jinping showed promising strides in trade while 70% of S&P 500 ($SPX) companies have beaten EPS estimates to date for first quarter - equal to the 5-year average. Additionally, 73% of $SPX companies have beaten sales estimates to date for Q1, well above the 5-year average (57%). [Earnings source: Factset]
-April 3, 2018 Market Update. This equity market research note is released before the market open today and futures have been up in the +0.60%-0.80% range. We reiterate that volatility typically extends for several months after the initial market correction (Feb 9th) and there is nothing unusual about this current cycle. The S&P 500 hit correction territory again yesterday when it tested the 2,556 level at 2:40pm EST; it also broke through -3% level loss. However, this consolidation phase of retesting the Feb 9th correction level demonstrated that there remains enough buyer interest at this market support range to drive a partial market recovery from the lows (S&P 500 finished the day at -2.23%). There are competing factors in play including: the market is correcting frothy valuations and is still processing a change to higher economic growth together with higher interest rates. Also, investor feverish sentiment toward stocks like the FAANGs - and other similar new tech like Tesla and Nvidia – had priced values to perfection in market segments that are not immune to challenges. Of course, Trump tariffs and trade war talk has only added more controversy and uncertainty in the equation – two ingredients abhorred by market bulls. From another perspective the market does great when information is being processed about higher company earnings, lower corporate taxes, higher economic GDP and infrastructure investment. Now that the discussion is about trade wars, regulations in social media, higher interest rates impact on the economy, flattening of the yield curve – then, that narrative has imputed caution back into play. We remind investors that timing the market in or out is not a strategy, nor is panicking. Also, while no one knows how long these markets will behave badly, we suggest investors (& their advisors) to use this volatility for buying opportunities and/or rebalancing allocations back in line with the long-term risk/return tolerance targets.
-April 2, 2018 Market Update. At least richly priced and overvalued equities are no longer the banner being waved by market bears as the elevated forward looking price-earnings ratio ("P/E") for the S&P 500 has sharply dropped from above 18x, to 16.1x today. This P/E coincidentally is the same P/E of the five-year average (also 16.1). Additionally, the estimated S&P 500 earnings growth rate for the first quarter 2018 is 17.3% and should this rate materialize, then this would mark the highest earnings growth since Q1 2011 [Source: FactSet]. What has driven the increase in the bottom-up EPS estimate for Q1 2018 and the entire year of 2018? The decrease in the corporate tax rate for 2018 due to the new tax law is clearly a significant factor in the upward revisions to EPS estimates. However, inasmuch as there has yet to be a sign that volatility has abetted history has proved that patient investors are rewarded with the best investment opportunities during bull markets that are afflicted with a market correction.
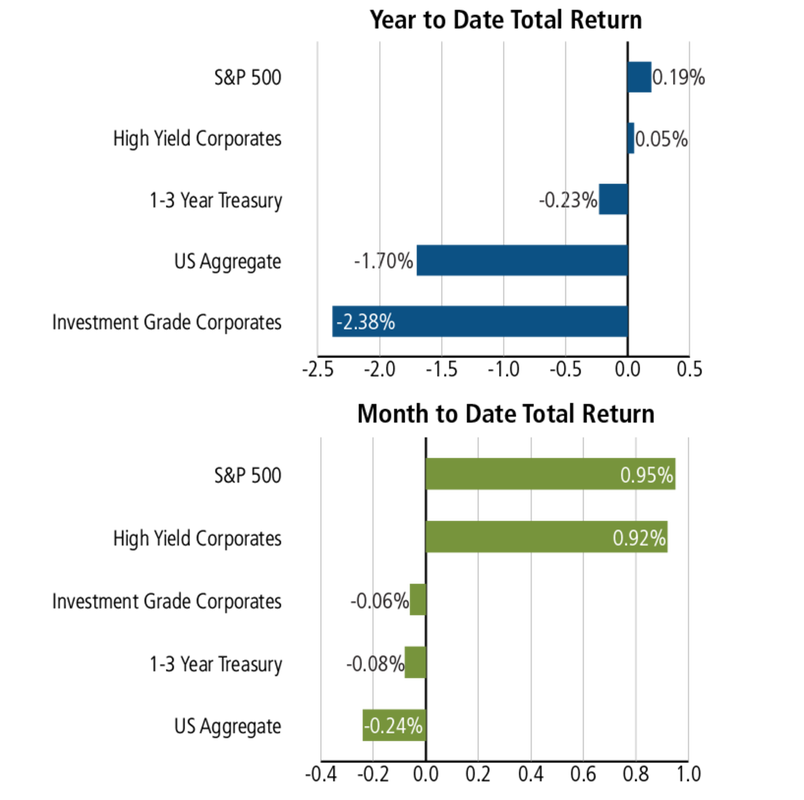
-April 1, 2018 Market Update. To the chagrin of most U.S. investors their quarterly broker statements will likely show the first loss since 2015 given both equities and bonds lost ground year-to-date. In fact, almost all investment asset classes struggled through a turbulent and volatile quarter in the capital markets. For example, the broad S&P 500 stock index fell -1.2% in the first quarter of 2018, snapping a nine-quarter stretch of gains. And, it wasn’t just domestic equities that took lumps during the quarter, as MSCI Europe also lost -2.0%, US Corporate Bond Index -2.2%, Bloomberg Aggregate Municipal Bond Index -1.1%, U.S. Intermediate Government Bond Index -1.7% and Ishares 3-7 year treasury -2.3%. Even silver and natural gas lost -4.8% and -7.4%, respectively. The most pain however was inflicted to those income-driven investors chasing high yield in master limited partnerships (MLPs) and for those investors that were naïve enough to have high weightings in MLPs probably experienced losses of around -9% for that asset class. Conversely, for those investors exposed to diverse multi asset portfolios - as employed in most of our clients' holdings - the ride should have been less wild and the losses more muted. For example, Pimco All Asset Fund eked out a gain, while certain alternative funds (like CPLSX +1.76%, JRSTX +1.57%, YCGEX +2.01%) all showed gains. Also, the preferred share holdings were largely flat and our largest bond holding of PONAX lost only -0.32%. Most of our individual client stock allocations have high exposure to defensive industries with higher yields and therefore have greater moat protection during volatile periods. For instance, industries like telecom, consumer staples and banks were also in the black so far this year. Going forward, we look for the first quarter earnings to start in this upcoming week of April and we expect positive double-digit growth; this highly visible and measurable source of positive data should help alleviate part of the market jitters associated with February and March (however, it will take a couple weeks before there are enough S&P companies reporting to have a consensus upward trend).


