August 19, 2022, Weekly Equity Market Recap. All three major equity indexes registered losses for the week with the S&P 500 down 1.2%, the Nasdaq off 2.6% and the Dow sliding 0.2%. After a few weeks of recovery gains, it appears the US stock market is entering a tug of war phase where it will likely just fluctuate until harder data, or the Fed, gives the directional signal. Yes, the jobs market, consumer spending and corporate earnings remain more resilient than expectation, but these trends will only make the Fed’s rates actions likely higher in the near-term. On a historical basis, the Federal reserve has never ended a rate hiking cycle with the Fed Funds rate lower than CPI, so assuming the Fed Funds rate around 3+ percent range by year end and inflation dropping back to 5% range, then there would likely be several more rate hikes hanging over 2023 forecasts. Meanwhile, we have good and the bad for the market to process, starting with the positive being with 90% of S&P 500 companies now having reported earnings, aggregate EPS growth for the second quarter (2Q) came in at 9.7%, well above the original estimates of 5.6%. Furthermore, 2Q corporate revenue growth of 13.7%, which was also better than expected. In contrast, on the negative side, home sales fell nearly 6% in July, and dropped about 20% from the same month a year ago, signaling that the housing market is sliding into a recession. Further, Atlanta Fed's GDPNow index was nudged down to a 1.8% growth rate for Q3 versus the prior 2.45% estimate from August 10. The Leading economic index declined 0.4% to 116.6 in July after falling 0.7% to 117.1 in June, marking the fifth straight monthly decline. In short, these contrarian trends will likely make the stock market rather choppy for a while.
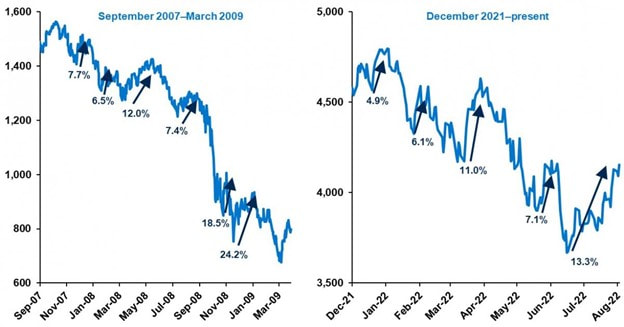
August 12, 2022, Weekly Equity Market Recap. The S&P 500 jumped 3.25% on the week, followed by the Nasdaq Composite higher by 3.08% and the Dow up 2.92%. Investors continue to celebrate signs that inflation is peaking with the Consumer Price Index coming in flat from June to July, thanks in large part to falling fuel prices. The Bureau of Labor Statistics July's Producer Price Index ("PPI") reading also showed a decline of 0.5% in July compared to June with the year-over-year gain of 9.8%; this was the first monthly decline since April 2020. Initial jobless claims released by the U.S. Department of Labor, rose to 262,000 last week. This was the highest figure since early November last year. The recession risk variables continue to grow with bank lending standards tightened through the warning level, consumer savings continue to drain, new household delinquencies up, and 3m-10yr interest rate inversion imminent. However, it is important to keep an open mind and consider a wide range of possible outcomes for both the economy and the stock market. Often times historical guidance is helpful with regard to the understanding the positive current stock market trends. Case in point, there were protracted down markets of 1973-1974, 2001-2003 and 2008-2009 where each experienced multiple bear market rallies. While this year’s bear market has experienced five through August, the latest, starting in mid-June, has seen the year-to-date equity market decline diminish from 24% to just 10%. While this represents a sizeable gain, it is, in fact, in line with the average range of bear market rallies in previous cycles
