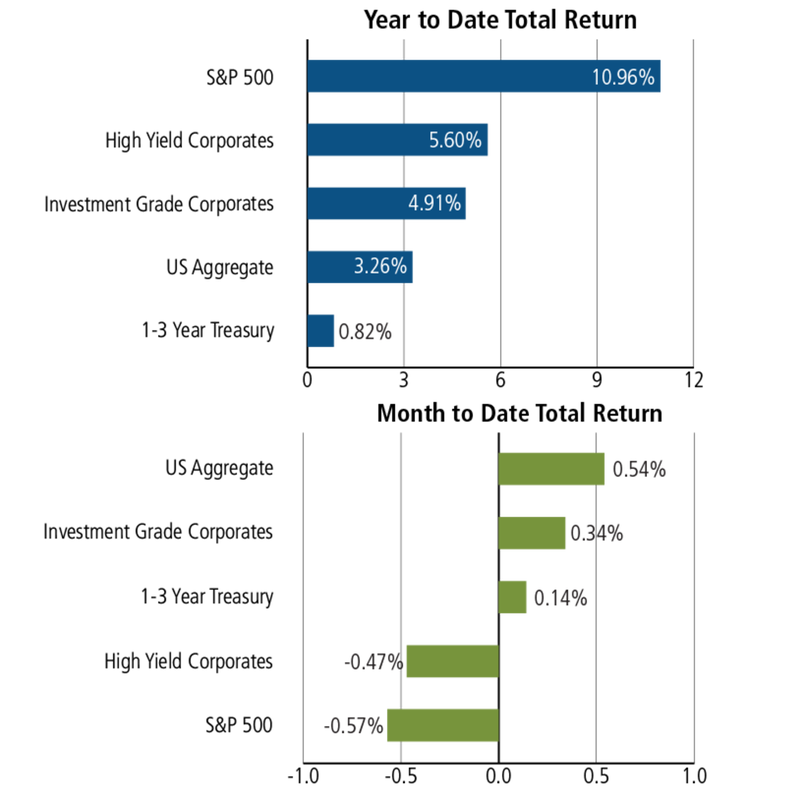
-August 17, 2017 Weekly Market Roundup. Volatility spiked again and all U.S. equity indexes took it on the chin once again for the week with the S&P 500 -0.55%, Dow Jones -0.77% and Nasdaq -0.64%. The fear index [CBOE Volatility Index, aka VIX] also surged by more than 30% on Thursday as U.S. stocks suffered their worst day in three months. Trading volumes began soaring after Standard & Poor's downgraded the U.S. credit rating and disappointing earnings from Wal-Mart and Cisco Systems. Moreover, the market was also rattled by a gloomy Morgan Stanley report that renewed fears about a slowing global economic recovery; the bank warned that the U.S. and Europe were "hovering dangerously close" to a recession in the next 6-12 months. Finally, the Barcelona terrorist event - a despicable and ghastly act - further unsettled global capital markets.
-August 11, 2017 Weekly Market Roundup. The U.S. Equity Market posted its second worst weekly loss for the year as markets declined on escalating tensions between the U.S. and N. Korea. The S&P 500 lost -1.37% and the Dow Jones returned -1.50% and the breadth was a large swath that included losses in all sectors. For example, the fear index which is often gauged by the CBOE Volatility Index (VIX), which had been at near historical lows, spiked 55% for the week. However, defensive sectors like consumer staples and utilities were essentially flat on the negative side. With respect to bonds, corporates also posted losses whereas flight to safety toward treasuries resulted in positive moves for U.S. government bonds. That said, earnings seasons continues to wrap-up on the positive side: 90%+ of companies in the S&P 500 have reported earnings with 70% meeting or exceeded analysts’ sales estimates while 82% have met or exceeded analysts’ earnings estimates.
-Market volatility has been abnormally low for months (VIX only at 10.5 vs. average of about 14.4) and it is important to be cognizant of historical trends. For example, VIX or volatility often spikes during the August-to-October period. For the last 20 years, August has been the worst month for the Dow Jones & S&P 500. The stock market hasn’t had a downward correction since February 2016, where it sold off 11%. Periodical market corrections typically occur about every 16-18 months, with technical 10% consolidation declines. It is interesting that we also just to happen to be entering that 16-18 month sweet spot within a calendar period for some form of S&P 500 market retrenchment. It is equally helpful to be mindful that there are a number of technical corrections during secular bull markets, and this is considered a heathy pattern. Moreover, bear markets are rare events without being preceded by early recessionary pressures. Indeed, about 75% of company stocks in the S&P 500 have exceed sales and earnings estimates in 2Q17, while the S&P 500 earnings racked +10.1% growth in the most recent quarter. On a macro economic front, unemployment hit a 16-year low and 2Q GDP is at a +2.6% pace.
-August 4, 2017 Weekly Market Roundup. The more diverse sector indexes like the S&P 500 and Dow Jones both were up for the week at +0.23% and +1.22% respectively, while the tech oriented Nasdaq index finished down again, -0.36%. Of the 420 companies in the S&P 500 that have reported earnings to date for Q2 2017 the year-over-year results have been up +10.1%. Moreover, 72.9% of the reported earnings have been above analyst expectations. Additional positive economic drivers also kicked-in for the week as the economy added 209,000 jobs in July, sharply higher than the expected 180,000. Unemployment has now hit a 16-year low of 4.3%.
