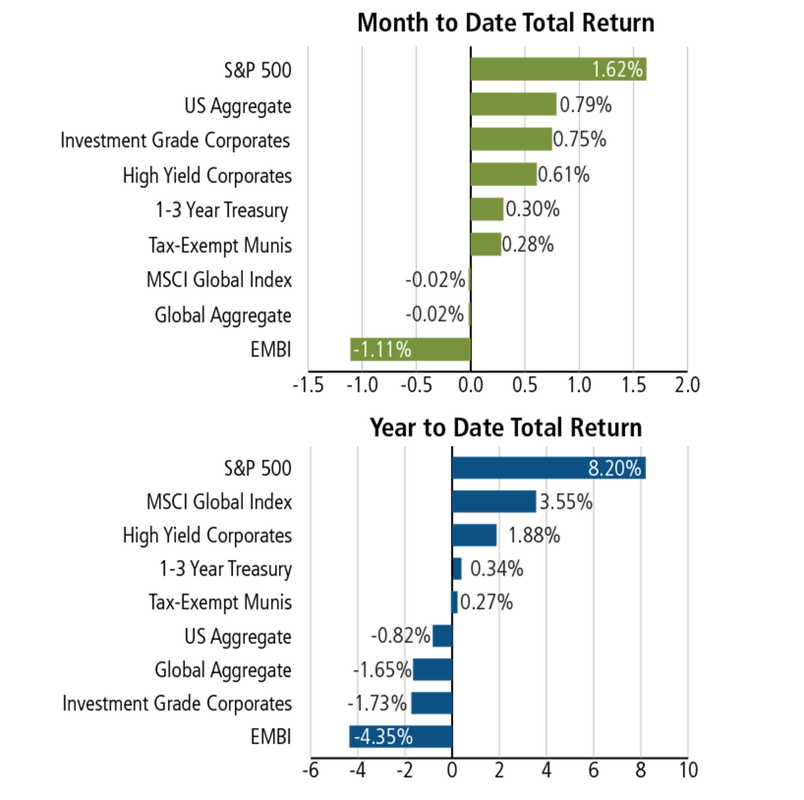
-August 24, 2018 Weekly Capital Market Update. The U.S. equity market rallied for the seventh time in eight weeks on strong 2nd quarter earnings results from retailers and higher oil prices. Despite the negative headlines surrounding President Trump’s former confidants, the broad equity market (S&P 500) rose +0.88%, Dow Jones Industrial Average finished +0.51% and the Nasdaq composite surged +1.66%. The best performing sectors were energy and consumer discretionary. Overall, August has been a relatively quiet month with low trading volumes still moving the indices higher. Federal Reserve Chairman Powell indicated that with continued strong economic growth, the Fed would continue its policy of gradual interest rate increases. Trade discussions with NAFTA and China continued but with no significant progress reported. With the overall positive equity market gains banked on the week, we are perplexed why the U.S. equity market has largely shrugged the negative political implications of Trump’s cohorts making immunity deals, including one criminal court case going against Trump’s former campaign chairman. Indeed, the media and press has turned feverish on coverage of potential impeachment implications; as advisors, we must evaluate these new developments and address certain clients that have elevated fears. While no one can be sure what will ultimately transpire, we turn to history for guidance and this suggests it would have little immediate impact on the market. In the two previous cases in recent memory—Nixon and Clinton—the market behaved differently, perpetually falling in the 12 months prior to Nixon’s impeachment, and rising before Clinton’s. The proper benchmark, however, is the Nixon era which had 12 months of loses prior to impeachment. The lesson learned is that such a prolonged loss period should still provide ample opportunity to shift portfolio asset classes to risk-off given it was not a dramatic jolt downward.
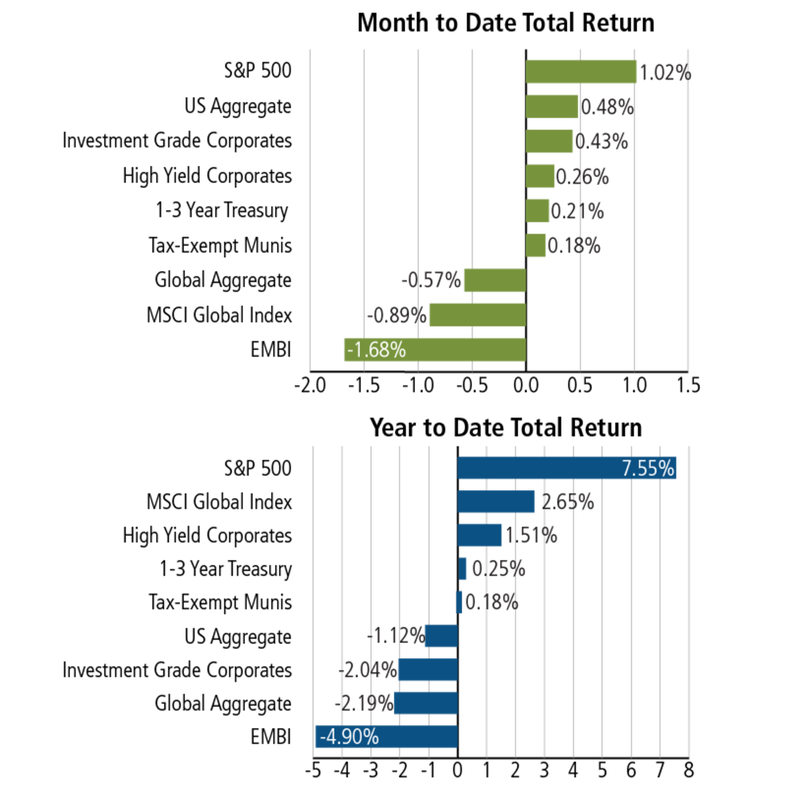
-August 17, 2018 Weekly Capital Market Update. Though a topsy-turvy week with Turkey’s currency devaluation and mixed corporate earnings results for the tail end of the season, the S&P 500 eked out a positive finish of +0.66%; however, the Nasdaq lost some ground on the week, -0.29%. The stock market continues to be in a tug-of-war between policy risks vs. strengthening economic and corporate fundamentals. However, from the Macro standpoint, valuation tailwinds remain and these include: 1) 4.1% GDP for 2Q18, 2) 40+ year low unemployment, 3) 20%+ US corporate earnings growth in the 1H18, 4) continued visible benefits from lower corporate taxes, 5) uptick in manufacturing trends and 6) supportive lending environment. Furthermore, the U.S. economy remains the beacon of innovation. Consider that the U.S. gross domestic product was approximately $1 trillion in 1930 and was more than $17 trillion at the end of 2017. That’s growth of 17x. Meanwhile, the U.S. population has grown less than 3x during that time span, to 320 million people from 120 million.
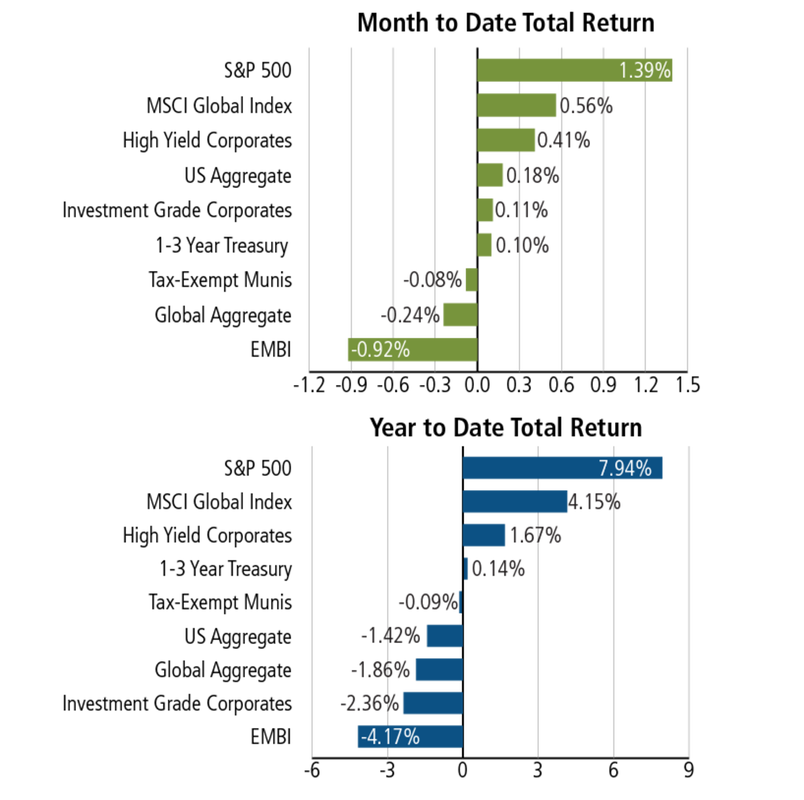
-August 10, 2018 Weekly Capital Market Update. The S&P 500® Index and the Dow Jones Industrial Average lost -0.25% and -0.59%, respectively, on the week. With no corporate headlines materially impacting markets this week and a typical time for summer vacations for market participants, trading activity was the lightest all year. The markets sold off on Friday in reaction to concerns that Turkey could become the next Greek tragedy; the lira declined as much as -20% on Friday. A survey among economists projected a 3.0% GDP rate for 2018, an improvement over surveys conducted last month (+2.9%) and a year ago (+2.4%). Over 90% of the companies in the S&P have reported quarterly earnings; approximately 84% have exceeded earnings estimates.
-August 4, 2018 Weekly Capital Market Update. Sector rotation driven by reversion to the mean where the big gaining sectors of high growth names, are experiencing weight allocation reduction and that money is now moving to other areas of the market. The mainstream U.S. equity market indices edged higher: the S&P 500® Index rose 0.76%, the Dow Jones Industrial Average inched +.05% and the Nasdaq Composite partially recovered with +0.96% (following two weeks of negative returns). Trade, energy, Brexit and earnings reports dominate the news headlines. So far, 80% of the companies in the S&P 500® have reported results and earnings growth is 24% in Q2 2018, which would be the second highest earnings growth since Q3 2010. Also, global economic growth estimates for 2019 has moved up to a very healthy +3.9%. However, trade tensions continue to also dominate the headlines: the U.S. announced an increase, from 10% to 25%, of the potential trade tariffs for Chinese goods; China quickly responded with plans to place tariffs on an additional $60 billion on U.S. goods including oil and natural gas.
Food for thought: August-September months have been notoriously volatile for the stock market on a historical basis. August has been even more of a headache for investors more recently. Since 1987, the Dow Jones industrial average has posted average losses of -1.1% in August, making it the worst month for equities in the past 30 years. August is also a popular vacation month for Wall Street and therefore any related volatility is usually driven by much more narrow breadth of volume.
Food for thought: August-September months have been notoriously volatile for the stock market on a historical basis. August has been even more of a headache for investors more recently. Since 1987, the Dow Jones industrial average has posted average losses of -1.1% in August, making it the worst month for equities in the past 30 years. August is also a popular vacation month for Wall Street and therefore any related volatility is usually driven by much more narrow breadth of volume.