
Whether you are currently working with us or simply following our market commentary, we believe it is important to provide clarity around both what is happening in markets and how portfolios should be positioned. This capital market update is a more detailed discussion of portfolio construction than we typically include in written commentary. Excluding our annual Capital Market Forecast, this represents one of our most extensive market-focused communications to date. However, for our clients, it provides a valuable lens into how real-world events translate directly into how we allocate capital, manage risk, and position portfolios across cycles.
This environment has also created a valuable learning moment, reflected in the calls and emails I am receiving from clients. On one end, investors understandably express concern about market declines and ask whether they should reduce exposure or move to cash. However, they also are curious why it appears that their portfolios remain positive this year despite headlines indicating markets are down 7%–10%, prompting them asking whether that can be accurate. I am going to answer that, and explain all aspects of how we invest and what goes into the process.
Markets are adjusting to a new set of conditions – not breaking. What matters is not avoiding volatility entirely, but structuring portfolios to navigate through it. When portfolios are built solely around market direction, outcomes tend to mirror headlines. When they are built across diversified return drivers with a focus on risk management, it is entirely possible – and expected to see meaningfully different results, including reduced drawdowns or even positive performance during periods when broad indices are under pressure.
Despite equity markets being down 7.0%-10.0% year-to-date, the aggregate of all client portfolios is up approximately +0.5% on the year, with many clients’ portfolios holding their year gains at over 2.0%. However, client risk aptitudes differ, and we also have clients showing losses, but only fractionally.
What is clear, and widely reflected across headlines and market reactions, is that the most immediate driver has been the escalation of conflict in the Middle East, particularly involving Israel and Iran. This has increased concern around potential disruptions to global oil supply, especially through the Strait of Hormuz, a key channel for global energy flow. Over 20% of the world’s oil supply transits through this corridor, and the escalation in conflict has raised the risk—whether perceived or realized—of disruption to that flow, which markets are now actively pricing in.
Not surprisingly, oil prices have moved sharply higher, recently pushing above $100 per barrel. For perspective, at the end of 2025 the price per barrel of oil was roughly $55, which translated into gas prices at the oil pump doubling in three months. Recent market volatility is being driven by a combination of geopolitical tension, rising energy prices, and shifting economic conditions, all of which have direct implications for both consumers and businesses.
We also are seeing the effects on the consumer level. With gas prices skyrocketing in such a short period, directly impacting household budgets, consumers are negatively impacted. When more income is spent on energy, less is available for discretionary spending. At the same time, businesses – particularly those tied to transportation, manufacturing, and logistics – are facing higher input costs. That combination puts pressure on both consumer demand and corporate margins, which ultimately feeds into earnings expectations and market valuations.
It is also important to recognize how this could evolve. If the conflict were to escalate further into a broader, boots-on-the-ground scenario, particularly involving key oil-producing regions, we could see crude oil move materially higher – potentially toward $150 per barrel. In that type of environment, markets would likely need to reprice further, and it would not be unreasonable to see an additional 10% downside in equities as inflation expectations rise, growth expectations weaken, earnings erode and the consumer is squeezed.
Historically, markets have experienced similar magnitude drawdowns during periods of geopolitical escalation and energy shocks. These moves, while uncomfortable, tend to be event-driven repricings rather than permanent impairments, and often stabilize as uncertainty begins to resolve or becomes better understood.
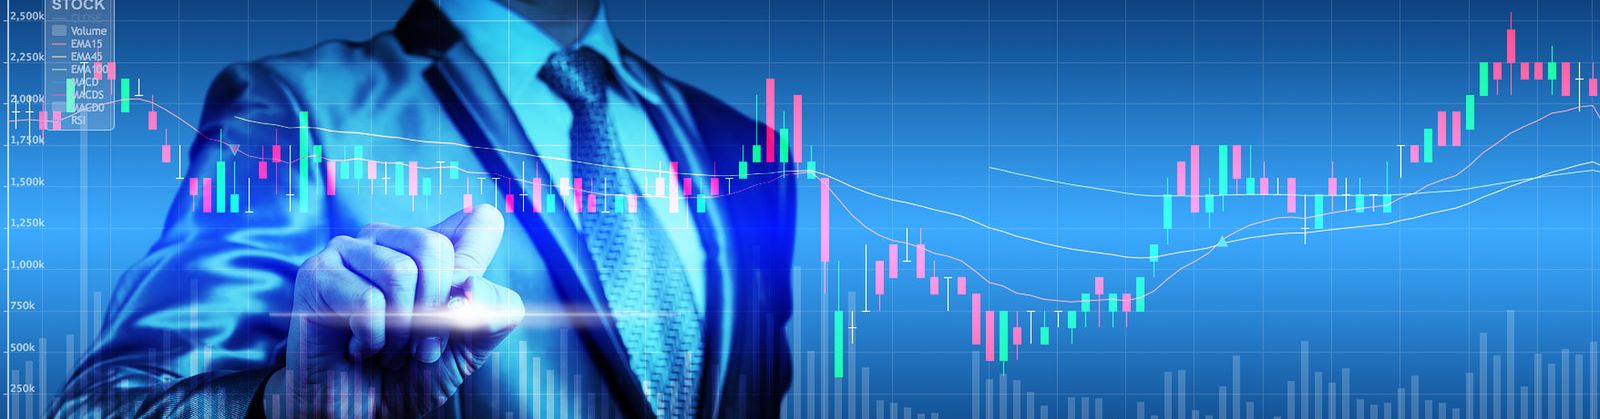
The S&P 500 is down approximately 7.45% this month, bringing year-to-date performance to roughly -6.96%. The Nasdaq Composite has declined more sharply, down about 7.91% this month and nearly -9.87% year-to-date, approaching formal correction territory. Conversely, the aggregate client portfolios we manage are positive for the year – but more on that later.
Beyond energy and geopolitics, recent economic data has also shifted the narrative. Inflation readings, particularly at the producer level, have come in higher than expected, suggesting that the path downward may not be as smooth as anticipated. Combined with rising import costs and ongoing supply adjustments, this has reintroduced concern around persistent inflation. At the same time, growth expectations are beginning to moderate, raising the possibility of stagflation—marking a slower growth environment paired with elevated inflation.
As a result, expectations for Federal Reserve policy have already shifted. Rather than rate cuts, markets are now pricing in a higher-for-longer interest rate environment, with the possibility of further tightening if inflation remains persistent. As Treasury yields have risen, equity valuations have compressed, growth assets have come under pressure, and market volatility has increased. This is a repricing of reality—not an anomaly. This divergence is expected. Growth-oriented sectors are more sensitive to rising interest rates, tighter liquidity, and higher discount rates. As those variables shift, those assets reprice more quickly. In short, markets are adjusting – not breaking.
It is important to view the current environment within the context of the broader market cycle. Corrections are typically defined as declines of approximately 10% and occur on average every 12–18 months. What we are seeing today, particularly within growth-oriented indices like Nasdaq, is consistent with that historical pattern. These periods are not indicative of structural breakdown – they are a normal part of how markets reset valuations, reprice risk, and extend longer-term cycles.
It is also important to recognize that all market forecasts are inherently probability-based, not certainty-based. At the start of the year, our Capital Market Forecast showed the probability set favored another positive return year for equities, supported by economic resilience and earnings growth, though with more moderate returns than the outsized gains of recent years. Insofar as our positive return outlook has not changed, the probability of outcomes has now changed. With new information, most notably the escalation in geopolitical risk and its impact on energy, inflation, and policy expectations—the distribution of outcomes shifted and has become less linear.
However, even with these new risks, a positive market return outcome remains to be our base, most probable outcome. Recall, we even forecasted for a market correction for the year, and subsequent recovery. Obviously, the first part of this forecast is currently in play. However, while the range of outcomes has widened, the center of that distribution remains intact. What has changed is the balance of risks around that base case—not the base case itself.
We generally refrain from detailing the full analytical framework behind how we value assets, form projections, and construct forward-looking forecasts. This process is both highly quantitative and rigorously developed and represents a proprietary investment discipline. After our team discussed the pros and cons of sharing our proprietary process publicly, we concluded it was too meaningful of differentiator not explain what is behind the hood of our market forecast.
Over time, we have found that this level of intellectual capital—particularly when it has demonstrated consistency over multiple market cycles—becomes highly valuable and in demand. As such, we are intentional about how broadly we share the underlying methodology, reserving the more detailed aspects of the process. Thus, I will share the macro drivers and reserve the intricacies behind our Market Regime Score (MRS). The rationale for limiting the scope is that I am sharing this with the overall public, and not just our clients who have signed the non-disclosures.
While I will not disclose the full mechanics such as factor weightings, model construction, or our internal statistical model framework that underpins our decisions, I can share the key macro drivers that inform how we allocate capital. I hope this will provide a clearer understanding of how we think about markets and, more importantly, how we have been able to deliver stronger long-term outcomes than most of our peers, while also having sharply reduced drawdowns. Importantly, what is being shared is intentionally simplified view.
We make financial investment judgments across a defined set of eight core capital market drivers and calculate a Market Regime Score (MRS):
1) Consumer Sentiment
2) Economic Growth GDP
3) Federal Reserve Policy
4) Government Policy
5) Inflation
6) Corporate Earnings
7) Liquidity & Financial Conditions
8) Valuation Price-to-Earnings Ratio
These inputs are incorporated into our proprietary quantitative models, which guide portfolio construction and asset allocation decisions. This is how we determine how portfolios should be positioned in terms of risk—not based on headlines, but on a structured evaluation of what we deem to be input factors that drive markets. Importantly, this process is ongoing as we continuously reassess and recalibrate this model.
Thus, this modality serves as the governing framework through which portfolio adjustments are evaluated and ultimately implemented for clients. It is not reactive or driven by short-term narratives, but rather a disciplined process rooted in predefined risk thresholds and evolving market conditions—ensuring that any changes are both deliberate and consistent with the overarching objective of preserving capital while compounding returns over time.
Again, at the beginning of 2026, the Market Regime Score (MRS) forecasted a positive return. Indeed, of the eight proprietary factors we capture, measure and then forecast, five were viewed as positive. The three factors considered negative were government policy (MAGA risk), inflation and valuation.
We had a probability of about 63% for positive S&P 500 gain on the year, or five out of eight probabilities. 63% is not our exact probability since there are many other nuances to the calculation, but I wanted to show you the basic concept. For example, three out of eight factor inputs are negative, giving a ratio of 63%. With the secret sauce, the exact positive return MRS was 69%. Again, not all factors are weighted the same in importance and there are also different probability impacts in the calculation, such as another 17 other factor sub-sets in the model.
So, while many Wall Street firms have changed their forecasts to a loss for the year, it is our position that one factor has changed negatively. So, instead of three factors, we now have four negative model input drivers, with geopolitical risk being the new negative. Recall, the other initial headwinds were inflation, valuations and government policy. Notably, we also have confirmation that having government policy as a negative input was correct, as it triggered the geopolitical Iran war.
With some understanding of our financial model, the probability of positive outcome has gone down. In the binary world of the stock market finishing positive or negatively however, the forecast would appear to be a coin flip based on the MRS. But with the different weightings and 17 subfactors the MRS is 56%. Even if it was 50%, we would change our allocations. Why, now we can’t forecast what will happen —gain or loss.
We do in fact adjust course when the facts change. Why spend years in graduate school studying finance, economics, statistics and capital markets? Then I get recruited to help manage billions of dollars for large institutions who wanted my academic investment model for investing, if I don’t act on the results.
After the end of the last bear market, which our model called months prior, the MRS set a bull market signal, and we actively realigned portfolios toward the asset classes and strategies best positioned for the evolving opportunity set. That portfolio will be risk on until we see probability drop below 50% for positive gains. Then we will use our own approach and judgement on how to invest within that framework.
We build multi-asset, all-weather portfolios, designed not for a single outcome, but to function across a wide range of economic environments. Rather than relying on market direction, we allocate across independent drivers of return, allowing different parts of the portfolio to perform under different conditions. This is not a static allocation—it is a dynamic, risk-aware framework.
This approach has been validated across multiple market environments. Over the past several years, client portfolios have generated double-digit returns broadly in line with equity markets, while maintaining minimal to no downside correlation during market corrections. That is by design: to meaningfully reduce downside participation – again, while still capturing a substantial portion of upside during risk-on environments, including largely matching the growth of the S&P 500 over time. That asymmetry is where long-term value is created.
We focus on how assets actually behave under stress, how correlations evolve in real environments, and how capital should be positioned accordingly. The objective is to achieve what is inherently difficult in traditional portfolio construction: mitigate downside during periods of stress while still participating meaningfully in market advances.
A clear example of this has been our position in fixed income and precious metals. Over the past several years, we have systematically reduced exposure to bonds as the risk-return profile deteriorated, while building more meaningful allocation to precious metals ahead of broader market recognition. Today, gold alone exceeds 10% across portfolios and has been appreciated significantly, generating returns more than 100% in just a few years. Obviously, real assets are altogether even higher concentration.
Most portfolios—and candidly, most advisory frameworks—remain anchored in a traditional stock and bond allocation that is heavily reliant on market direction, often accompanied by a default recommendation to “stay the course” in all environments. In turn, we pursue what we believe is the best of both worlds—a structure that emphasizes loss mitigation while still sharing in positive market returns. Yes, we also hold some traditional stocks and bonds, view stocks and bonds as not being diversified as one portfolio. During market stress both go down and are not real diversifiers.
So, our first line of defense is liquid alternative, hedge strategies: tradable long/short equity, market neutral strategies, global macro, event-driven investing, and trend-following or managed futures. We also incorporate option-based strategies and buffered equity exposures, which help reduce downside while maintaining upside participation. Because many of these approaches target absolute returns, they tend to exhibit lower correlation to traditional assets and provide a more stable return profile—particularly during periods of market stress.
Alongside this sits a second layer of diversification: real assets and inflation-sensitive exposures, including commodities, precious metals, and real asset strategies. These exposures respond differently to inflation, supply constraints, and real economic activity—factors that can pressure both stocks and bonds simultaneously.
Together, this creates diversification not just across asset classes, but across return drivers, correlations, and risk exposures. This is further structured through a risk parity framework, where capital is allocated across growth, rates, inflation, and non-directional strategies rather than concentrated in equities. The result is a more balanced and resilient portfolio, particularly in environments where traditional diversification becomes less effective.
Equally important is how we think about opportunity through the lens of all the risks, and then what returns could be expected and is it worth it. We then design portfolios to look beyond macro headlines and allocate across asset classes where forward-looking return potential is most compelling, always grounded in client objectives rather than benchmarks.
Avoiding significant drawdowns is one of the most powerful drivers of long-term compounding. A portfolio that declines 50% requires a 100% return simply to breakeven. In contrast, a portfolio that meaningfully mitigates that downside is structurally positioned to compound more efficiently and, over full cycles, generate meaningful outperformance relative to peers.
In practice, this is what enables our client portfolios to make a lot of money—both with strong consistent gains and loss mitigation. Our portfolios participate meaningfully in upside while thoughtfully managing downside risks. What differentiates our approach is that we begin with risk as the chief task—how to avoid meaningful loss of capital—recognizing that returns are ultimately a function of how well risk is managed over time.
Delivering both growth and downside protection consistently is a difficult balance—one few pursue with real discipline. While most advisors speak to risk and return, the industry remains largely focused on marketing returns, often without equal transparency around the risks required to achieve them.
Our approach starts from a different premise: risk—not return—is the primary driver of outcomes. A portfolio’s true structure is defined not by how capital is allocated, but by how risk is distributed. Traditional allocations often appear diversified, yet in practice concentrate risk in a single driver—typically equities.
We address this by measuring the risk contribution of each asset and strategy, allowing us to understand how the portfolio is truly exposed. Portfolios are then constructed by balancing risk across independent drivers of return, rather than allocating based on forecasts.
This framework separates two decisions: how risk is distributed, and how much total risk to take. Once risk is properly balanced, exposure can be scaled to align with client objectives and market conditions. The result is a more resilient structure—where returns are a byproduct of disciplined risk allocation, not concentrated bets.
Our approach discipline, grounded in discipline and continuity, and is the right approach from my perspective. With my own money, I also want to make money, but I am more worried about how much I can lose. When I break that down further, from an emotional standpoint, I guess I care more about losing money than making money. So, in pursuit of investing I want to make as much as possible but don’t want to lose much. It is as simple as that.
I am available to discuss your portfolio in more detail. Please feel free to contact me with any questions and concerns.
Kip Lytel, CFA
Founder, Montecito Capital Management