Weekly Stock Market Recap I S&P 500 Monthly Summary June 2023

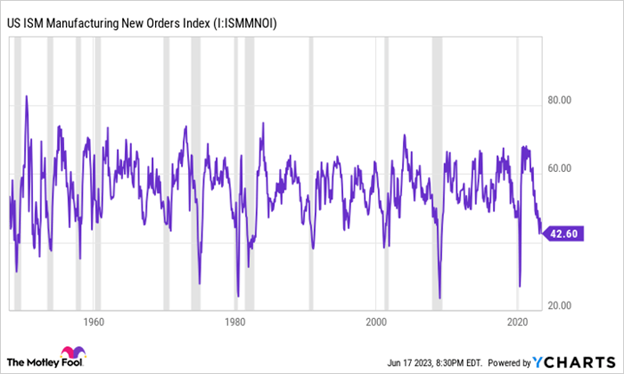
June 23, 2023, Weekly Stock Market Return Recap. The stock market reacted negatively to Fed Chair Powell’s statements this week with the S&P 500 and Nasdaq both ending down 1.4% and the Dow Jones falling 1.8%. The broad market index of the S&P 500 decline was the largest since March with most trade days finishing in the red on the week. Powell’s remarks at a House Financial Services Committee hearing Wednesday were perceived as hawkish, characterized with statements “The process of getting inflation back down to 2 percent has a long way to go” and “Nearly all FOMC participants expect that it will be appropriate to raise interest rates somewhat further by the end of the year.” The week’s economic news was highlighted by ISM’s Manufacturing New Orders Index which contracted for the ninth consecutive month in May, registering 42.6 percent, a decrease of 3.1 percentage points. Historically, declines below the 43.5 range in the ISM New Orders Index have been a reliable signal of impending U.S. recessions. Indeed, out of the more than one dozen occasions where the ISM Manufacturing New Orders Index has below 43.5, only one proved to be a false-positive for a U.S. recession, and that occurred way back in the 1950s.  Another factoid is should a U.S. recession occur, history would suggest that the Dow, S&P 500, and Nasdaq Composite have yet to reach their true bear market lows, as no bear market after World War II has bottomed prior to an official recession being declared.

June 16, 2023, Weekly Stock Market Return Recap. On a bullish Fed rate pause, the S&P 500 finished up +2.6% on the week, marking its best performance since March of 2023. After 10 consecutive interest rate hikes over the past 15 months, the Federal Reserve finally decided to pause during Wednesday’s Fed meeting. This rate pause will give the Fed further time to process incoming economic data and inflation. Yet, it might be premature to take out the party bowl as the Fed’s decision comes with the projection of another two 25 basis point rate hikes ahead in 2023; this would move the benchmark rate into the 5.50% and 5.75% range. The market probability tracker shows that the central bank’s future rate hikes have about a 60% chance the Fed will hike rates by 0.25% in the next July meeting. Back to the equity markets, it is important to highlight the unhealthy balance in the S&P 500 recovery, as the concentration of stock leaders is the most concentrated since 1970’s. Indeed, seven tech stocks – Apple, Microsoft, Alphabet, Amazon, Nvidia, Tesla and Meta – have accounted for most of the S&P 500’s recovery with 40%-80% range bound gains, while the other 493 stocks are largely flat in aggregate. Moreover, the top five stocks now represent nearly one-quarter of the S&P 500 market capitalization. Those lopsided percentages are even higher than at the peak in the dot-com bubble of 2000, where the market lost 43% of its value over three years. Unless the breadth of stock participation in the rally expands, this does not bode well for the sustainability of the stock market recovery. Therefore, client portfolios will remain diversified with neutral risk standing until which time we see both more supportive economic data and broader market sector participation in stocks.


June 9, 2023, Weekly Stock Market Return Recap. Stocks rose on the week moving the S&P 500 broad market index into new bull market territory with a +20% recovery from the lows back in October of last year. For the week, the S&P 500 finished up 0.4%, the Dow gained 0.3% and the Nasdaq eked out 0.1%. However, over one half of the 11 sectors in the S&P 500 are still in the red, while Information Technology (+35%) and Communication Services (+33%) sectors are largely carrying the index upward on the year. Yes, insofar as the sector participation breadth has increased in June from previous months, the fact that technology and to a smaller part, consumer discretionary, are driving the positive equity index market gains on the year is a sign the lingering problems for the prospects of a healthy, sustainable bull market.


June 2, 2023, Weekly Stock Market Return Recap. Stocks buoyed on jobs data and debt default averted. For the week, the S&P 500 rose 1.82%, the Dow added 2.02% and the Nasdaq gained 2.04%. A lot of positive developments on the week with the government debt ceiling suspended for two years and unemployment jumping to a seven-year high at 3.7%; in particular, the easing of labor spiked sentiment that the Federal Reserve may skip a rate hike in two weeks.

Post

Weekly Stock Market Recap I S&P 500 Monthly Summary May 2023

May 26, 2023, Weekly Stock Market Return Recap. The US equity markets finished mixed for the week on cross currents of news, with the Nasdaq and S&P 500 up 2.5% and 0.3%, respectively, while the Dow Jones lost 0.1%. The Fed’s attempt to slow the US economy received pushback on consumer spending news with a spending increase by 0.8% in April, marking an uptick in pace after two months of modest 0.1% gains. Also, technology stocks got a huge boost with Nvidia’s (NVDA) blowout financial performance and guidance of robust future growth in artificial intelligence (AI). Also, toward the end of the week, stocks were propelled by US Treasury’s Yellen extending the government debt default deadline by five days, to June 6th and then House Majority Leader McCarthy sharing “progress” on negotiated talks to extend the US government debt ceiling. 

May 19, 2023, Weekly Stock Market Return Recap. Equity markets ended the week higher as prospects regarding a deal to raise the debt ceiling boosted market sentiment. The Nasdaq led the indexes up +3%, followed by the S&P 500 +1.6% and the Dow Jones at +0.4%. In Bank of America’s latest fund manager survey, 71% of investors indicated they expect a debt ceiling resolution before the “X-Date.” The other driving force for market sentiment has been the FOMC omitting a line from its previous statements of “anticipates that some additional policy firming may be appropriate.” This line removal set the stage for expectations of a Fed rate increase pause for the June meeting. On the economic front, retail sales rose 0.4% last month, missing economists’ expectations for a 0.8% increase. Case in point, Home Depot (HD) reported its biggest revenue miss in more than two decades. Faltering consumer demand has forced the home-improvement retailer to lower its forecast for the year. Also, Target’s (TGT) management warned about a continued softening of consumer demand.

May 12, 2023, Weekly Stock Market Return Recap. The S&P 500 and Dow Jones Industrial Average logged their second weekly loss in a row of -0.2% and 0.03%, respectively. The regional bank turmoil continues to weigh on investor sentiment.  Case in point, data showing consumer sentiment declined by more than expected to 63.5 in April, the lowest reading since last November last year. Though the broad market stock index is up mid-single digits on the year, there is an unhealthy narrow market breadth with the top 10 stocks holding about 30% weight in the index and comprising around 70% of year-to-date performance. According to this week’s data from the Bureau of Labor Statistics released Wednesday morning, the Consumer Price Index (CPI) revealed headline inflation rose 0.4% over last month and 4.9% over the prior year in April.

May 5, 2023, Weekly Stock Market Return Recap. The major Indices opened the week on a positive note, but couldn’t hold onto any gains, with the S&P 500 ending the week 0.8 percent lower. Regional banks suffered another day of sizable losses as anxiety crippled the markets Thursday with new set of banks, PacWest and Western Alliance, at risk of failure, prompting The SPDR S&P Regional Banking index to close at its lowest level since October 2020. Investors were so pessimistic that fed-fund futures began to register as much as a 10% chance the Fed will cut rates in June.  Also, energy has been a drag on stocks these past weeks as the markets price-in a recession. For example, GDP growth for Q1 did decline, from 2.6% in Q4 of 2022 to 1.1%; the consensus was in the 1.6%-1.8% range. However, it appears any recession will have a shining light of employment which means healthy, with the April jobs report showing stronger than expected job gains with the unemployment rate falling to 3.4%. On the week, the Fed raised interest rates 0.25%, escalating inflation fight.  Fed Chair Powell’s comments were “Inflation pressures continue to run high,” and “The process of getting inflation back down to 2% has a long way to go.” Powell noted the removal of a sentence that was previously in place in the Fed’s rate hike announcements that said “some additional policy increases might be appropriate.” Powell characterized the omission as “meaningful,” saying a decision about any additional rate hikes would be “data dependent.”

Post

Weekly Stock Market Recap I S&P 500 Monthly Summary April 2023

April 28, 2023, Weekly Stock Market Return Recap. Boosted by the strength of mega caps, the S&P 500® posted a positive 2% return in April, outpacing smaller cap stocks.  However, almost one-half of that return was driven by only two sectors, Communications and Information Technology, which indicates that sector breadth is still narrow with many sectors lagging. As we enter the second quarter (Q2), inflation and the Fed remain at center stage, but with added worry of brewing problems with bank reserves, future bank lending and existing commercial loan portfolios. Morgan Stanley Chief Investment Officer Mike Wilson wrote a recent note on major near-term risk for stock prices. Wilson said the regional banking crisis triggered an unusual surge in liquidity that elevated stock prices prior to earnings seasons. He also asserted that the business cycle is slowing and that earnings remain far too high. Wilson further noted that when forward earnings-per-share (“EPS”) growth goes negative, which is the current trend, the Fed usually cuts rates, not hikes them. But with four-decade-high inflation, the Fed has hinted that cutting rates won’t be in the conversation until 2024. Below, is a graph of the current relationship between earnings growth and the S&P 500 return on a five-year historical basis:

April 21, 2023, Weekly Stock Market Return Recap. All US equity indexes posted muted losses on the week, led by Nasdaq -0.4%, followed by Dow Jones -0.2% and with the broad market equity index finishing essentially flat at -0.1%. Markets continue to feel the drag of the financial sector, with disappointing earnings and deposit surplus concerns.  The top sector performer on the week was the defensive sector of consumer staples, led by Proctor & Gamble (PG) earnings beating estimates and finishing up +3% on Friday; shares of Home Depot (HD), Lowe’s (LOW), and Kimberly-Clark (KMB) also finished strong. While inflation trends are declining, the services sector remains sticking. For example, core services inflation is outpacing core goods inflation by a significant degree. Interestingly, though, the annual change in core goods inflation ticked up for the first time since summer 2022, while the annual change in core services ticked down for the first time since summer 2021.

April 14, 2023, Weekly Stock Market Return Recap. All US equity indexes edged upward on the week: S&P 500 closed up 0.8%, Dow Jones finished +1.2% and Nasdaq inched +0.3%. The US equity markets have been rebounding these past 6 weeks, but it is important to keep in mind that a bear market has never bottomed out before a recession begins. As investors brace for an economic slowdown, this week began with the most significant net short position in the S&P 500 futures since 2011. Furthermore, the breadth of the market remains lackluster, with 57% of stocks in the S&P 500 trading below their 200-day moving average. The Consumer Price Index (CPI) revealed headline inflation rose 0.1% over last month and 5.0% over the prior year in March, a slowdown from February’s 0.4% month-over-month increase and 6% annual gain. March’s inflation of 5.0% was down from June’s 9.1%, marking the slowest annual increase in consumer prices since May 2021, and growing ever closer to the Federal Reserve’s 2% target. Both measures were slightly better than economist forecasts of a 0.2% month-over-month increase and 5.1% annual increase, according to data from Bloomberg.

April 6, 2023, Weekly Stock Market Return Recap. On a short holiday trading week, the US equity market indexes finished mixed: The S&P 500 lost -0.1% on the week, posting its first losing week in four, while the Nasdaq fell -1.1%. However, the Dow Jones stayed afloat, rising +0.6% on the week. Both the Institute for Supply Management (ISM) Manufacturing and Purchasing Managers’ Index (PMI) showed that the economy did worse than expected in March, falling to quarterly lows. The bellwether of business conditions ISM’s overall reading was 51.2, which was far below expectations of 54.4 and last month’s reading of 55.1. Similarly, the PMI reading came in at 46.3, which is notable since a reading below 50 indicates a contraction.  Finally, inflation trends continue to ease as marked by the Personal Consumption Expenditures (PCE) inflation data for February was slightly softer at 0.3% vs 0.4% expected.

March 31, 2023, Weekly Stock Market Return Recap. All three US equity indexes spiked more than 3% on a weekly basis. For the month, the S&P 500 closed 3.51% higher, while the Nasdaq jumped 6.69%.  Insofar as the headline gains are impressive, the positive territory gains are largely recovery trends that are yet to be supported by wide sector market breadth support. For example, Apple and Microsoft accounted for about one-half of the S&P 500’s monthly gains. Another way to break this down is that while the S&P 500 is now up 7.5% year-to-date, the Information Technology sector contributed +5.44% of that total gain for the first quarter (Q1FY23). Indeed, only four of the 12 sectors in the S&P 500 are meaningfully up, with four sectors in the red and another four sectors about breakeven on the year. The catalyst for the market recovery this month is that the real federal-funds rate is quickly approaching positive territory. In the past, this has signaled the end of rate hikes, with the central bank likely only having one further rate hike ahead.

Post

Weekly Stock Market Recap I S&P 500 Monthly Summary March 2023

March 24, 2023, Weekly Stock Market Return Recap. The S&P 500 dropped as much as 1% in early Friday trading, the most in a week, reverse into positive territory to close +0.57% on the week. Likewise, the Dow Jones Industrial and technology-laden Nasdaq Composite ended the week up +0.4% and +0.3%, respectively. The Federal Reserve raised interest rates by a quarter of a point and changed guidance to indicate that the end of increases is near. Previously, the Fed has included a line in its statement that its policy-making committee expected “ongoing increases” in the Fed Funds rate, but the line was omitted from the March 22 post-meeting statement. In its place, the FOMC added new phrasing noting that they “will closely monitor incoming information and assess the implications for monetary policy.” Fed Chairman Jerome Powell also said that lending conditions may have tightened more than what’s indicated, increasing economic uncertainty. The interest rate move to proceed in its inflation-fighting efforts comes despite turmoil in the banking system.  For example, with two bank failures and one French bank rescue takeover, U.S. commercial bank deposits are down 3%, an unprecedented $537 billion drop.  

March 17, 2023, Weekly Stock Market Return Recap. The collapse last week of Silicon Valley Bank and Signature Bank led to a sharp market sell-off of bank stocks, while the news also rippled into other financial sectors, and ultimately the contagion impacted stocks across the board with Real Estate and Industrials also taking it the shorts during the week (as both sectors depend on lending). However, the up days overcame down days with FDIC backstopping deposits, First Republic Bank getting $10 billion credit lines from 10 banks and news that UBS is pursuing an acquisition of Credit Swiss.  The markets were further supported by the silver lining that though the high rates are taking a toll on banks, this in turn, my prompt the Fed to stop raising rates and maybe even lower rates faster when they do lower rates.  Other economic news was The U.S. Bureau of Labor Statistics’ February Consumer Price Index showed inflation eased in February as prices rose 6.0% from a year earlier – increasing the likelihood that the Federal Reserve could end rate hikes soon.  Also, the Federal Reserve Bank of Philadelphia’s Manufacturing Index contracted for the seventh-straight month with significant deterioration in the six-month outlook.

March 10, 2023, Weekly Stock Market Return Recap. Jarred by the second largest US bank to ever fail, the S&P 500 skidded 1.4 percent on Friday, finishing the week down 4.5 percent and marking its worst week of the year. The decline was led by Silicon Valley Bank’s (SVB) failure to meet regulatory reserve requirements and subsequently placed under FDIC control.  The US equity markets were also disrupted by Fed Chair Powell comments early this week indicating that rates will be “higher for longer” as the Fed continues to do what is necessary to battle down inflation. Fed Chair Powell’s remarks before the Senate Banking Committee: “The latest economic data have come in stronger than expected, which suggests that the ultimate level of interest rates is likely to be higher than previously anticipated … prepared to move in larger steps if the “totality” of incoming information suggests tougher measures are needed to control inflation.” After a strong start to the year most of the S&P 500 gains have since been given back, and therefore it is important to reflect upon historical guardrails at this juncture. During a Bear market, the S&P has never hit a low before the 2-year treasury yield has peaked. With the 2-year hitting a cycle high of 5% this week, that portends the October low for the indices very well may not be the low.

March 3, 2023, Weekly Stock Market Return Recap. The S&P 500 notches its first winning week in past four weeks finishing up +1.6%; The Dow Jones Industrial Average climbed 1.2%, while the Nasdaq composite spiked 2%.  The market is looking for any silver lining with inflation and decided to clutch on to the Institute for Supply Management Service Index where the released monthly figure for February showed that inasmuch as prices are still rising for what is paid by services organizations, the growth decelerated in February. Indeed, the U.S. ISM Services Index is little changed in February, easing to 55.1 during February from an unrevised 55.2 in January, according to the Institute for Supply Management. Other market supportive news was Federal Reserve Bank of Atlanta President Raphael Bostic said he favors using smaller interest rate adjustments to fine-tune monetary policy and thinks it could pause by mid-summer.

Post

Weekly Stock Market Recap I S&P 500 Monthly Summary Feb 2023

February 24, 2023, Weekly Stock Market Return Recap. The markets continued to be rattled by lingering inflation as recent economic data has increased expectations that the Fed will have to move higher and hold interest rates at higher rates for an extended period. The US major equity averages all ended the week with their biggest losses in 2023. The S&P 500 was down 2.7%, marking not only its third weekly loss but its worst week since Dec. 9th of last year. The Dow fell almost 3.0% this week — its fourth straight losing week. The Nasdaq closed 3.3% lower, notching its second negative week in three. Two Federal Reserve officials suggested Friday morning that inflation could persist longer than thought after the central bank’s most closely watched inflation gauge surged by the most in months. The Fed’s Kansas City’s Bank Manufacturing Survey for February showed that prices paid for raw materials and prices received for goods increased compared to January.  The core personal consumption expenditures price index increased 0.6% for the month of January; consumer spending rose more than expected as prices increased, jumping 1.8% for the month vs. the estimate for 1.4%.


February 17, 2023, Weekly Stock Market Return Recap. U.S. equities finished lower for the second consecutive week with economic data showing persistent inflation and hawkish comments from Fed members, weighing on market sentiment. The equity index loss leader was the Nasdaq down -0.6%, followed by the S&P 500 finished off -0.3% and the Dow Jones -0.1%. This week six-month Treasury bills topped 5% for the first time since 2007, marking a sign that markets are coming around to our view that overnight rates will go above 5% and stay for a while. Credit card debt hit an all-time high — just shy of $1 trillion — in the final three months of 2022, delinquencies among borrowers accelerated. Indeed, personal credit balances grew $61 billion in the fourth quarter from the previous one to $986 billion, marking the largest quarterly increase and the highest total since the series tracking began in 1999.


February 10, 2023, Weekly Stock Market Return Recap. The S&P 500 fell -0.9% on the week with all 11 broad sectors of the benchmark index ending in negative territory.  The market continues to receive strong job data, fueling concern that the Fed will continue to raise interest rates and harm the economy. This is also why the fear-gauge CBOE Volatility Index (VIX) was up 5.5% to 20.  Also, bonds finished lower on the week pushing yields to the highest in over a month.


February 3, 2023, Weekly Stock Market Return Recap. The broad US equity indexes finished mixed on the week, led by the Nasdaq +3.3% followed by the S&P 500 +1.05, while the Dow Jones lost -0.15%.  Markets were uplifted by incremental declines in inflation and a lower option of 0.25% Fed rate increase. Also, The Federal Reserve comments offered silver lining: “While recent developments are encouraging, we will need substantially more evidence to be confident that inflation is on a sustained downward path,” and “it’s good news that declines in inflation in recent months have not come at the expense of a weaker labor market.”

Post

Weekly Stock Market Recap I S&P 500 Monthly Summary Jan 2023

January 28, 2023, Weekly Stock Market Return Recap. For the week, the Dow finished up 1.8%, the S&P 500 added 2.5%, and the Nasdaq soared 4.3%. The Commerce Department’s latest Personal Consumption Expenditures (PCE) Price Index showed inflation eased with prices only rising 4.4% from a year ago. The market is also reacting to disparate regional Fed Bank comments, ranging from hawkish to dovish, but most recently St. Louis Fed Bank President James Bullard said the central bank is close to achieving restrictive monetary policy and he favors interest rates topping 5% sooner than later. On the corporate earnings front, FactSet noted: “The Q4 earnings season for the S&P 500 continues to be subpar. While the number of S&P 500 companies reporting positive earnings surprises increased over the past week, the magnitude of these earnings surprises decreased during this time. Both metrics are still below their 5-year and 10-year averages.”

January 20, 2023, Weekly Stock Market Return Recap. The S&P 500 declined -0.7%, the Dow fell -2.7% and the Nasdaq rose +0.6% on the week. The fourth quarter earnings season for the S&P 500 is not off to a strong start: of the 11% companies that have reported only 67% have reported earnings above estimates, which is below the 5-year average of 77%.  The weekly economic news showed weaking with the Producer Price Index (“PPI”) for December with a decrease in costs, down 0.5% from the prior month while December retail sales dropped sharper than expected as consumer spending slowed in the traditionally strong holiday season. Federal Reserve Bank of Cleveland President Loretta Mester said inflation growth is finally starting to slow but interest rates need to rise above 5%. Recall, Fed Chair Powell comments on 1/10 Tues, Fed taking ‘measures that are not popular’ to rein in inflation.


January 13, 2023, Weekly Stock Market Return Recap.  The US equity indexes all jumped on the week led by the Nasdaq +4.8%, followed by the S&P 500 +2.7% and Dow Jones +2.0%.  The market expectations for an early than conveyed interest rate pause by the Fed continues to seesaw, but now with the expectation that the Fed’s hawkish stance will cave earlier. December’s CPI report showed prices continue to eke downward, by 0.01%, heightening hopes the Fed may pause rate hikes sooner than its current stance. Also, early signs of earnings strength by banks and airlines show the bottom lines in these sectors remain healthy.  We believe the stock market will continue to be impacted more by sentiment waves attached to what the Fed may, or may not do, with rate increases this year.


January 6, 2023, Weekly Equity Market Recap. The first week of January for the S&P 500 was marked by consistent declines then after a strong recovery on Friday, finishing positive +1.45%. Indeed, stocks on Friday were moved sharply higher by softer U.S. wage data and an unexpected contraction in the Institute of Supply Management’s December services reading. However, the performance results likely come to no surprise to investors given a recent survey found that over half of US investors were so terrified about portfolio losses that they checked their retirement balances three times a week.

Post

Investment Insights & Financial Facts for the Month of February

-February 24, 2017 Weekly Market Roundup. U.S. equity markets continued hitting records this week — including 10 day record of closing highs in a row for the Dow Jones as of 23 February. The U.S. equity market climbed modestly higher in a holiday-shortened week. Investors gravitated towards conservative areas of the market, with utilities being the strongest performers followed by consumer staples companies, such as food and beverages.  With the fourth quarter earnings season now behind us and a relatively light week of corporate headlines, investors’ were squarely focused on the new Administration’s corporate tax reform. Equity markets remain optimistic that Trump will cut taxes, reduce regulation and implement a sweeping infrastructure spending program. The S&P 500 Index is up +5.3% year to date and has gained over +21% over the past 12 months. The yield on the 10-year US Treasury bond fell -2.9% this week to 2.34%

-February 17, 2017 Weekly Market Roundup. The U.S. Equity Markets surged to new record highs this week on increased investor optimism surrounding the Trump administration’s tax reform, improving economic data, and strong corporate earnings results. The generally positive fourth quarter earnings have provided a greater sense of optimism of improving economic growth in 2017.  Day-to-day, the markets tend to respond to the latest pronouncements from Washington DC. In turn, municipals bonds are at the cheapest levels relative to taxable bonds since at least December, with ratios to taxable Treasury bonds making munies look more attractive. Treasuries absorbed stronger economic data and a more hawkish Yellen at the Humphrey-Hawkins testimony to finish the week 10-12 bps lower in yield. March rate hike probabilities ended the week at 40%.

-Below is the summary of potential Trump’s tax reform proposals which appear on the surface to be pro-economic growth, bullish for equities and corporate net profits:

  • Reduce Capital Gains and Dividend Tax Rates from current high of 20% to 16.5%
  • Eliminate Carried-Interest Deduction (taxed at ordinary income)
  • Collapse the seven current individual brackets into three brackets 33%, 25% & 12%: a top rate of 33% ($112.5K+ individual and $225K+ joint); 25% under $112.5K individual/$225K joint; and 12% for those earning under $37.5K individual/$75K joint
  • Eliminate 3.8% Obamacare surtax on investment income
  • Eliminate Estate Tax and Alternative Minimum Tax (AMT)
  • Expansion of EITC/CTC Tax Credits for lower-income Americans (potentially extra $1000+ per month for working-poor)
  • House GOP plan eliminates all itemized deductions besides the mortgage interest deduction and the charitable contribution deduction (raises $2.3T over 10 years)

Two technical factors may lend support to asset valuations and provide a cushion against the slew of event risks looming this year:  First, in a recent study, JPMorgan highlighted that there was a decline in equity supply last year & this created support for equity markets. This trend is anticipated to be an accommodating mechanism in 2017 as global equity supply should further shrink with share buybacks, mergers and leveraged buyouts. Second, net supply of new U.S. investment-grade debt could decline by as much as 31 percent to $511 billion in 2017 thanks to a wave of maturing bonds and coupon payments, according to Bank of America Corp’s calculation. In short, altogether there appears to be less equity supply and more cash coming into play which should bode well for lofty equity valuations. Moreover, there is another component – Wall Street firms (such as RBC) expect corporate earnings to “re-accelerate” to 7.8% growth with profitability being fuelled by an improved operating environment for “financials, less –onerous regulations, and energy.”

-February 3, 2017 Weekly Market Roundup. Markets rebounded from early losses to end the week roughly flat with the S&P 500 adding +0.1 percent to 2,297.42 on the week as the Dow Jones Industrial Average lost -0.1 percent to 20,071.46. More than half of S&P 500 companies have reported earnings and profits are beating expectations by an average 3.3 percent, even as revenue figures fall in line with analyst projections. Earnings are up 5.5 percent on average (the first time EPS growth for two consecutive quarters since 2015) with eight of 11 industry groups posting gains. Friday showed the U.S. added 227,000 net new jobs in the month of January. Relative to expectations, top-line job growth surprised to the high side and continued to impress. The 3-month moving average is 183,000—a good sign for economic growth, stocks, and credit.

-A recent study by FinMason found that a whopping 43% of investors do not know what risk tolerance is and 73% of the survey respondents indicated that their advisor never discussed or explained the potential for portfolio losses that could occur with another big market crash. A conversation explaining volatility, particularly downward portfolio moves, and how it can be controlled through asset allocation is the best way to approach the understanding.  For example, we show clients that equity declines of -5% or more are quite frequent at three times a year on average, while -10% or more occur about once a year and -15% or more once every two years on average.  Bear market events with equity losses exceeding -20% or more are infrequent, occurring every 3.5 years and lasting about a year in duration.  Portfolio diversification may help reduce risk, and the lower the correlation between returns from different securities in a portfolio, the greater the diversification benefit. Successful diversification depends upon combining asset classes that are not perfectly correlated.

Today (2/1/17), the FOMC left its target range unchanged at 0.50%–0.75%, and reiterated that “gradual increases” in the federal funds rate are still planned. There also appears to be a bias of no move for the March meeting. The only new issue mentioned concerned consumer and corporate sentiment, which were noted to “have improved of late”. The 10-year Treasury notes are highly sensitive to small changes in interest rate expectations. This can be beneficial when interest rates are declining, but quite the opposite when interest rates are on the rise. After returning +8.0% during the first half of 2016, 10-year U.S. Treasury notes returned -7.5% during the second half of the year as their yields rose by more than 1%.

Post

Investment Insights & Financial Facts for the Month of January

-January 27th, 2017 Weekly Market Roundup. The S&P 500 finished for a weekly gain of +1.0%, the NASDAQ was up +1.9% during the week and the Dow Jones Industrial Average Index closed above 20,000 for the first time ever this week. As of today (with 34% of the companies in the S&P 500 reporting actual results for Q4 2016), 65% of S&P 500 companies have beat the mean EPS estimate and 52% of S&P 500 companies have beat the mean sales estimate. For Q4 2016, the blended earnings growth rate for the S&P 500 is 4.2%. Also, the CBOE Volatility Index, the so-called “fear gauge,” hit a more than two-year low this week as signs of an improving global economy and expectations for business-friendly policies. The initial estimate of fourth quarter GDP showed the U.S. economy grew at a 1.9% rate, helped by strong consumer spending, a pickup in business investments, and a rebound in home construction.  The pace exceeded weaker growth in the first half of 2016 but slowed considerably from third quarter’s 3.5% growth rate. The market probability for a rate hike at next week’s Fed meeting hovered at 22%.

-January 20th, 2017 Weekly Market Roundup. Equity markets finished slightly down for the week with the S&P 500 -0.2% decline, the Dow -0.3% and NASDAQ off -0.3%.  Over the last month, the day-to-day changes in the S&P 500® Index have stayed within one percentage point while the Dow Jones Industrial Average has stalled just shy of reaching 20,000.  Earnings for the fourth quarter kicked off with generally strong results for financial stocks that were the first to report.  Of the  63 companies in the S&P 500® Index that have reported fourth quarter earnings results, 46% have exceeded sales estimates and 63% have exceeded earnings per share (EPS) estimates.  Overall, analysts expect sales to rise 4.2%, to mark the Index’s fastest growth since the third quarter of 2014. 

Total Returns by Asset Class (YTD Jan 20, 2017)

al equities.  Since international markets peaked in 2007 right before a global financial meltdown, Morningstar data show that developed international stocks – as measured by the MSCI EAFE index – had lost a cumulative -6% through last week. At the same time, the MSCI Emerging Markets index had slid -16.6%.

-January 13th, 2017 Weekly Market Roundup. Markets shifted between modest gains and losses this week to close roughly unchanged. The upcoming fourth quarter corporate earnings reports should provide indications of near-term market direction, and more importantly, insight from management teams’ outlooks for the year.  For example, a few large financial firms have reported fourth quarter results with favorable revenue & profit trends, including very positive remarks on the business prospects moving forward. Ahead of the reporting season, analysts are projecting the companies within the S&P 500  index to have revenue increases of +4.6%, along with improved earnings (+3.2%). The World Bank said this week it expects the world economy to expand +2.7% this year, on the heels of stabilizing and slightly rising commodity prices and fiscal stimulus in the US.

-The Conference Board’s Consumer Confidence Index climbed to 113.7 (1985=100) – the highest level since August 2001. It moved +4.3 points higher than November’s level, while beating the prior forecast of 109 (according to Bloomberg reports).  Further, the Markets: Proportion of consumers expecting higher share prices in 2017 increased to 44.7% in December, the largest since January 2004.

-January 6th, 2017 Weekly Market Roundup. Equity markets welcomed the New Year with gains in all sectors as all major indices advanced. While the Dow fell just short of reaching 20,000, the S&P 500 closed at an all-time high on Friday. Driving much the rally has been the incoming Trump administration’s priorities including tax, health care, and regulatory reform as well as infrastructure spending. Also, helping equities march higher was the December jobs report, which showed that the economy added 156,000 jobs in December and average hourly earnings grew 2.9% over the past year.

Montecito Capital Management Group’s 2017 Market Outlook & Forecast:
As we enter 2017 we expect the current economic rebound to continue suggesting GDP growth will likely move toward the 2.7%-3.0% level by the end of the year based on less monetary stimulus, more fiscal stimulus, a reduction in the corporate tax rate and deregulation.

The S&P 500 equity index is currently trading at about a forward 2017 price-earnings ratio of 17x which is a rich value, but not as lofty as the 2000-2001 tech bubble (nor as cheap as 2009). Wall Street currently forecasts a +5.5% gain for the S&P 500 in 2017 (average of 15 firms) and sees the index reaching 2,363 by year end, from its 12/31/16 close of 2,239. We believe the market has the potential for +7.5% in 2017 given more indirect investment currents where lackluster bond downward pricing will likely engender an extended redistribution from bonds to equities. We also believe the S&P 500 returns will be front loaded, where the largest percentage of gains will be in the first half of 2017.

The incoming administration has promised a much more business-friendly atmosphere including lower taxes and less regulation. Trump has control over both houses of Congress. Also, in the years when that has occurred, equiteies have returned an average of +14% per annum. Having Congressional & Executive Branch control is historically rare for a Republican administration. Trump wants to cut the corporate tax rate, and congress is in agreement, making it likely to happen. According to Citi, if the rate was cut to 20%, it would add $12 to their top-down estimate of $130 for 2017 S&P 500 earnings per share (or about +10%,).

2016 Returns By Sector, Shows Clear Sector Winners, Losers & Benchwarmers:

Post

Investment Insights & Financial Facts for the Month of December

-December 30th, 2016 Weekly Market Roundup. Markets declined in the final week of the year on light trading volume over the holiday.  Indeed, the Dow Jones Industrial Average recorded its first weekly loss since the presidential election. Nevertheless, the Trump election rally has propelled the major indices to impressive gains in 2016. For the year, the S&P 500® Index rose +9.5% and the NASDAQ advanced +7.5%.  However, 2016 did not lift all boats, with typical safe haven equity sectors down, with healthcare finishing down by over -4% and consumer staples ending essentially flat for the year. Meanwhile, U.S. government bonds declined for the second consecutive year.

-December 23rd, 2016 Weekly Market Roundup.  Stock market took a holiday break this week. Volatility dipped below 11 percent on Wednesday, the lowest the VIX index has hit since August 2015, and all three major indexes moved by 0.3 percent or less. Global equities dipped modestly this week while US indices barely budged.

-The U.S. Federal Reserve raised interest rates on Wednesday the 14th by a quarter point, or +0.25%. The Federal Open Market Committee raised its target range from 0.25 percent to 0.50 percent to a range of 0.50 percent to 0.75 percent. The overnight funds rate currently sits at 0.41 percent.  Committee members lifted their expectations for GDP growth from 1.80 percent in 2016 to 1.90 percent, and 2.1 percent in 2017 against the previous estimate of 2.0 percent.  The Fed continued to describe that pace as “gradual,” keeping policy still slightly loose and supporting some further improvement in the job market. It sees unemployment falling to 4.5 percent next year and remaining at that level, which is considered to be close to full employment.

-December 9th, 2016 Weekly Market Roundup. The recent market rally resumed with stocks recording their best weekly performance since the presidential election.  On Friday, the Dow Jones Industrial Average, S&P 500® Index, NASDAQ, and Russell 2000® all reached new record highs. In contrast, safe haven dividend income areas that have outperformed in recent years – including Utilities and Food & Beverage, and Household Products stocks – have fallen since the election.  Likewise, bonds continue to drop in value as investors anticipate an environment with higher growth and higher inflation; long-dated fixed income investments are less attractive under these conditions.  In this environment, our Model Portfolio and Growth Portfolios are faring well, but the retiree income portfolio remains lackluster.  Looking under the hood in equity sectors show a different picture than what is discussed by the media. For example, the health care sector is down -3.7% ytd, consumer staples sector is only up 2.0% ytd, large growth stocks are only up 3.0% ytd, while REITs have lost about -3% these past three months. Moreover, the long-term corporate bond is down -7.3% over the past three months, US Core Corporate Bond has lost -3.2% in the past 13 weeks; government bonds are down -3.8%.  The takeaway is we have short-term rotations going on with sharp differences between winning and losing sectors and asset classes.  For example, financials are up over 22% this year, with basic materials and energy also both up over 20% this year – these are being driven by the perception that Trump will pour a trillion dollars in America’s infrastructure, including a wall. However, all this spending needs approval and Trump has shown that he sometimes exaggerates on what he wants to do versus on what he can do – such as getting a trillion dollars from congress. Hence, the bifurcation in sector performance may not have legs and sector rotational trends may recalibrate and normalize in the intermediate-term. Again, big sector winners are offsetting the anemic returns in what many consider to be the more stable equity sectors.

-December 2nd, 2016 Weekly Market Roundup. Equity markets retreated this week as the post-election rally stalled, with the S&P 500 finishing down -1.0% while the Russell 2000 lost -2.5%. The Barclays U.S. Aggregate Bond Index lost -2.4% in November to mark its worst drop in 10 years due to the strengthening U.S. economy (expected Fed increase), rising oil prices and the prospect of increased government spending under the Trump administration (more debt). The upcoming Italian election (called the referendum) could make it a tough trading period for the US markets on Monday (Sunday for EU). If the referendum is lost, it could prove a catastrophe for Italian bank shares and perhaps bank shares all across Europe.

Post

Investment Insights & Financial Facts for the Month of November

-November 25th, 2016 Weekly Market Roundup. Equities continued their post-election rally as major indexes reached record highs Friday and have risen in each of the past three weeks.  The S&P 500 Index finished the quarter with a gain of +3.9%. However, the performance gap between the best-&-worst-performing sectors during the quarter was more than 16%. Information technology, financials, and industrials were the strongest performers, delivering gains of +12.9%, +4.6% and +4.1%, respectively. The telecommunications services, utilities, and consumer staples sectors were the poorest relative performers, posting losses of -5.6%, -5.9% and -2.6%, respectively.  Hence, the latter sectors are largely viewed as dividend income, which took it on the chin. However, it is essential to be mindful that dividend income is a critical component of the S&P 500’s historical total return, contributing about 40%.

-November 18th, 2016 Weekly Market Roundup. The S&P 500 index gained 0.8% for the week while the Nasdaq Composite (+1.6%) outperformed after lagging one week ago. Conversely, the Dow Jones Industrial Average (+0.1%) underperformed after showing relative strength during the election week. In contrast, typically more stable areas of the market, including high-dividend stocks (including UtilitiesFood & Beverage, and Household Products), declined. The market’s immediate Trump related focus will be on potential tax reform that, by some estimates, could boost corporate earnings by as much as 10%, followed by growth policies, infrastructure investment and the potential of allowing US companies to repatriate cash at a slashed 10% rate. Fed Chair Janet Yellen remarked Thursday, in her testimony before the Joint Economic Committee, that the U.S. economy is strong enough to withstand a rate hike, which could come “relatively soon.” Global bond markets continue to be driven by heightened inflation expectations. The yield on the bellwether 10-year U.S. Treasury, which moves in the opposite direction of its price, climbed to 2.34% on November 18, its highest level in more than a year.

-The current U.S. stock market trading trends have been unusual and a bit bipolar. For example, there has been odd sector rotation, where just yesterday (Nov 16th) more than 300 securities on the New York Stock Exchange hit 52-week highs, while more than 300 securities also hit 52-week lows.

-A recent Wall Street Journal article argues that Donald Trump’s presidency may cause a big downturn in the US real estate market and thus REIT investments. Trump is forecasted to boost growth and cause inflation, but it might be the impact that he has already had which will be the biggest factor for mortgage markets—higher rates. 30-year mortgage rates have already jumped 25 basis points since his election, and the higher interest rates which are expected to accompany his presidency could well cool the real estate market by putting currently lofty prices out of the reach of many borrowers. Prices have risen so much over the last few years in part because big mortgages were affordable compared to incomes as a result of really low rates.

-As a result the Trump Tantrum, the capitalization of a global bond-market index slid by $450 billion Thursday, a fourth day of declines that pushed the week’s total bond losses above $1 trillion for only the second time in two decades, via Bloomberg. In addition, Bank of America Merrill Lynch data showed the 30 year yields jumped (bonds dropping) the most this week since January 2009, and the week is not over yet. Trump’s policies are expected to see inflation trending upwards over the coming years which is traditionally bad for bonds. Other income plays have also been hard hit – For example, RIETs have sold off and dividend equity sectors like Utilities and Consumer Staples are also down for the week. In turn, certain equity sectors rallied strongly on the Trump win such as basic materials (related to the Trump infrastructure investment initiative) and financials (expectation of higher rates, bringing greater profit spread for banks), healthcare, among others.

-Trump pulled off a surprise victory last night with the equity futures turning down in the -4.o% range.  However, this morning the US equity indices are relatively steady, given certain sectors are offsetting losses in others.  For example, Healthcare, Industrials & Financials are actually rallying.  The S&P 500 has been teetering between -0.5% to +0.30 so far this morning.

November 4th, 2016 Weekly Market Roundup. Equity markets closed lower across the board for the second straight week as all major indices and economic sectors retreated; the S&P 500 finished the week nearly -3% below its record high reached in mid-August. The S&P’s weekly loss marked the ninth consecutive day of declines for the S&P 500 Index, the longest stretch since December 1980. This statistic seems ominous on the surface, but surprisingly stocks historically have generally increased after similar declines, rising on average by 7% over the following six months. On the economic front third quarter’s GDP report came in at a better-than-expected 2.9% – this growth rate has not seen since the third quarter of 2014. The Federal Open Market Committee (FOMC) left rates steady at its November meeting but strongly indicated that a hike is likely at the next meeting in December.

-The S&P 500 just completed seven (7) straight days of market losses. This level of daily losses is similar to the longest loss run in the past two decades (which was during the market crash of 2008), where the equity index fell for eight straight days. Fortunately, the difference between now and 2008 was back then the fall was far more steep and violent.

-“Going back 88 years, when stocks advance in the three months before the election, the nominee representing the party in the White House almost always wins (Hillary). When stocks are down in that period, the candidate challenging the incumbent party usually triumphs. Thus it can be said that the Standard & Poor’s 500 index has correctly predicted 19 of the past 22 presidential elections” according to a recent Barron’s piece. Now consider that the S&P 500 has fallen more than 4% since the start of August.

Post