Investment Insights & Financial Facts for the Month of February

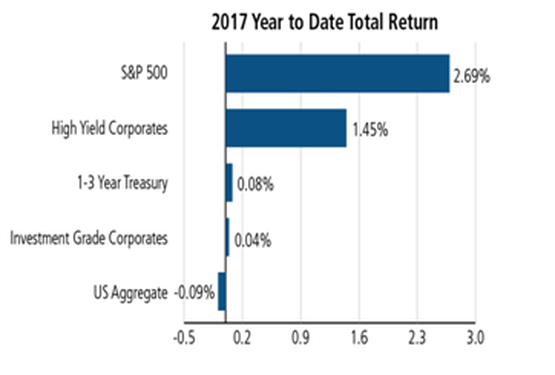
-February 24, 2017 Weekly Market Roundup. U.S. equity markets continued hitting records this week — including 10 day record of closing highs in a row for the Dow Jones as of 23 February. The U.S. equity market climbed modestly higher in a holiday-shortened week. Investors gravitated towards conservative areas of the market, with utilities being the strongest performers followed by consumer staples companies, such as food and beverages.  With the fourth quarter earnings season now behind us and a relatively light week of corporate headlines, investors’ were squarely focused on the new Administration’s corporate tax reform. Equity markets remain optimistic that Trump will cut taxes, reduce regulation and implement a sweeping infrastructure spending program. The S&P 500 Index is up +5.3% year to date and has gained over +21% over the past 12 months. The yield on the 10-year US Treasury bond fell -2.9% this week to 2.34%

-February 17, 2017 Weekly Market Roundup. The U.S. Equity Markets surged to new record highs this week on increased investor optimism surrounding the Trump administration’s tax reform, improving economic data, and strong corporate earnings results. The generally positive fourth quarter earnings have provided a greater sense of optimism of improving economic growth in 2017.  Day-to-day, the markets tend to respond to the latest pronouncements from Washington DC. In turn, municipals bonds are at the cheapest levels relative to taxable bonds since at least December, with ratios to taxable Treasury bonds making munies look more attractive. Treasuries absorbed stronger economic data and a more hawkish Yellen at the Humphrey-Hawkins testimony to finish the week 10-12 bps lower in yield. March rate hike probabilities ended the week at 40%.

-Below is the summary of potential Trump’s tax reform proposals which appear on the surface to be pro-economic growth, bullish for equities and corporate net profits:

  • Reduce Capital Gains and Dividend Tax Rates from current high of 20% to 16.5%
  • Eliminate Carried-Interest Deduction (taxed at ordinary income)
  • Collapse the seven current individual brackets into three brackets 33%, 25% & 12%: a top rate of 33% ($112.5K+ individual and $225K+ joint); 25% under $112.5K individual/$225K joint; and 12% for those earning under $37.5K individual/$75K joint
  • Eliminate 3.8% Obamacare surtax on investment income
  • Eliminate Estate Tax and Alternative Minimum Tax (AMT)
  • Expansion of EITC/CTC Tax Credits for lower-income Americans (potentially extra $1000+ per month for working-poor)
  • House GOP plan eliminates all itemized deductions besides the mortgage interest deduction and the charitable contribution deduction (raises $2.3T over 10 years)

Two technical factors may lend support to asset valuations and provide a cushion against the slew of event risks looming this year:  First, in a recent study, JPMorgan highlighted that there was a decline in equity supply last year & this created support for equity markets. This trend is anticipated to be an accommodating mechanism in 2017 as global equity supply should further shrink with share buybacks, mergers and leveraged buyouts. Second, net supply of new U.S. investment-grade debt could decline by as much as 31 percent to $511 billion in 2017 thanks to a wave of maturing bonds and coupon payments, according to Bank of America Corp’s calculation. In short, altogether there appears to be less equity supply and more cash coming into play which should bode well for lofty equity valuations. Moreover, there is another component – Wall Street firms (such as RBC) expect corporate earnings to “re-accelerate” to 7.8% growth with profitability being fuelled by an improved operating environment for “financials, less –onerous regulations, and energy.”

-February 3, 2017 Weekly Market Roundup. Markets rebounded from early losses to end the week roughly flat with the S&P 500 adding +0.1 percent to 2,297.42 on the week as the Dow Jones Industrial Average lost -0.1 percent to 20,071.46. More than half of S&P 500 companies have reported earnings and profits are beating expectations by an average 3.3 percent, even as revenue figures fall in line with analyst projections. Earnings are up 5.5 percent on average (the first time EPS growth for two consecutive quarters since 2015) with eight of 11 industry groups posting gains. Friday showed the U.S. added 227,000 net new jobs in the month of January. Relative to expectations, top-line job growth surprised to the high side and continued to impress. The 3-month moving average is 183,000—a good sign for economic growth, stocks, and credit.

-A recent study by FinMason found that a whopping 43% of investors do not know what risk tolerance is and 73% of the survey respondents indicated that their advisor never discussed or explained the potential for portfolio losses that could occur with another big market crash. A conversation explaining volatility, particularly downward portfolio moves, and how it can be controlled through asset allocation is the best way to approach the understanding.  For example, we show clients that equity declines of -5% or more are quite frequent at three times a year on average, while -10% or more occur about once a year and -15% or more once every two years on average.  Bear market events with equity losses exceeding -20% or more are infrequent, occurring every 3.5 years and lasting about a year in duration.  Portfolio diversification may help reduce risk, and the lower the correlation between returns from different securities in a portfolio, the greater the diversification benefit. Successful diversification depends upon combining asset classes that are not perfectly correlated.

Today (2/1/17), the FOMC left its target range unchanged at 0.50%–0.75%, and reiterated that “gradual increases” in the federal funds rate are still planned. There also appears to be a bias of no move for the March meeting. The only new issue mentioned concerned consumer and corporate sentiment, which were noted to “have improved of late”. The 10-year Treasury notes are highly sensitive to small changes in interest rate expectations. This can be beneficial when interest rates are declining, but quite the opposite when interest rates are on the rise. After returning +8.0% during the first half of 2016, 10-year U.S. Treasury notes returned -7.5% during the second half of the year as their yields rose by more than 1%.

Post

Investment Insights & Financial Facts for the Month of January

-January 27th, 2017 Weekly Market Roundup. The S&P 500 finished for a weekly gain of +1.0%, the NASDAQ was up +1.9% during the week and the Dow Jones Industrial Average Index closed above 20,000 for the first time ever this week. As of today (with 34% of the companies in the S&P 500 reporting actual results for Q4 2016), 65% of S&P 500 companies have beat the mean EPS estimate and 52% of S&P 500 companies have beat the mean sales estimate. For Q4 2016, the blended earnings growth rate for the S&P 500 is 4.2%. Also, the CBOE Volatility Index, the so-called “fear gauge,” hit a more than two-year low this week as signs of an improving global economy and expectations for business-friendly policies. The initial estimate of fourth quarter GDP showed the U.S. economy grew at a 1.9% rate, helped by strong consumer spending, a pickup in business investments, and a rebound in home construction.  The pace exceeded weaker growth in the first half of 2016 but slowed considerably from third quarter’s 3.5% growth rate. The market probability for a rate hike at next week’s Fed meeting hovered at 22%.

-January 20th, 2017 Weekly Market Roundup. Equity markets finished slightly down for the week with the S&P 500 -0.2% decline, the Dow -0.3% and NASDAQ off -0.3%.  Over the last month, the day-to-day changes in the S&P 500® Index have stayed within one percentage point while the Dow Jones Industrial Average has stalled just shy of reaching 20,000.  Earnings for the fourth quarter kicked off with generally strong results for financial stocks that were the first to report.  Of the  63 companies in the S&P 500® Index that have reported fourth quarter earnings results, 46% have exceeded sales estimates and 63% have exceeded earnings per share (EPS) estimates.  Overall, analysts expect sales to rise 4.2%, to mark the Index’s fastest growth since the third quarter of 2014. 

Total Returns by Asset Class (YTD Jan 20, 2017)

al equities.  Since international markets peaked in 2007 right before a global financial meltdown, Morningstar data show that developed international stocks – as measured by the MSCI EAFE index – had lost a cumulative -6% through last week. At the same time, the MSCI Emerging Markets index had slid -16.6%.

-January 13th, 2017 Weekly Market Roundup. Markets shifted between modest gains and losses this week to close roughly unchanged. The upcoming fourth quarter corporate earnings reports should provide indications of near-term market direction, and more importantly, insight from management teams’ outlooks for the year.  For example, a few large financial firms have reported fourth quarter results with favorable revenue & profit trends, including very positive remarks on the business prospects moving forward. Ahead of the reporting season, analysts are projecting the companies within the S&P 500  index to have revenue increases of +4.6%, along with improved earnings (+3.2%). The World Bank said this week it expects the world economy to expand +2.7% this year, on the heels of stabilizing and slightly rising commodity prices and fiscal stimulus in the US.

-The Conference Board’s Consumer Confidence Index climbed to 113.7 (1985=100) – the highest level since August 2001. It moved +4.3 points higher than November’s level, while beating the prior forecast of 109 (according to Bloomberg reports).  Further, the Markets: Proportion of consumers expecting higher share prices in 2017 increased to 44.7% in December, the largest since January 2004.

-January 6th, 2017 Weekly Market Roundup. Equity markets welcomed the New Year with gains in all sectors as all major indices advanced. While the Dow fell just short of reaching 20,000, the S&P 500 closed at an all-time high on Friday. Driving much the rally has been the incoming Trump administration’s priorities including tax, health care, and regulatory reform as well as infrastructure spending. Also, helping equities march higher was the December jobs report, which showed that the economy added 156,000 jobs in December and average hourly earnings grew 2.9% over the past year.

Montecito Capital Management Group’s 2017 Market Outlook & Forecast:
As we enter 2017 we expect the current economic rebound to continue suggesting GDP growth will likely move toward the 2.7%-3.0% level by the end of the year based on less monetary stimulus, more fiscal stimulus, a reduction in the corporate tax rate and deregulation.

The S&P 500 equity index is currently trading at about a forward 2017 price-earnings ratio of 17x which is a rich value, but not as lofty as the 2000-2001 tech bubble (nor as cheap as 2009). Wall Street currently forecasts a +5.5% gain for the S&P 500 in 2017 (average of 15 firms) and sees the index reaching 2,363 by year end, from its 12/31/16 close of 2,239. We believe the market has the potential for +7.5% in 2017 given more indirect investment currents where lackluster bond downward pricing will likely engender an extended redistribution from bonds to equities. We also believe the S&P 500 returns will be front loaded, where the largest percentage of gains will be in the first half of 2017.

The incoming administration has promised a much more business-friendly atmosphere including lower taxes and less regulation. Trump has control over both houses of Congress. Also, in the years when that has occurred, equiteies have returned an average of +14% per annum. Having Congressional & Executive Branch control is historically rare for a Republican administration. Trump wants to cut the corporate tax rate, and congress is in agreement, making it likely to happen. According to Citi, if the rate was cut to 20%, it would add $12 to their top-down estimate of $130 for 2017 S&P 500 earnings per share (or about +10%,).

2016 Returns By Sector, Shows Clear Sector Winners, Losers & Benchwarmers:

Post

Investment Insights & Financial Facts for the Month of December

-December 30th, 2016 Weekly Market Roundup. Markets declined in the final week of the year on light trading volume over the holiday.  Indeed, the Dow Jones Industrial Average recorded its first weekly loss since the presidential election. Nevertheless, the Trump election rally has propelled the major indices to impressive gains in 2016. For the year, the S&P 500® Index rose +9.5% and the NASDAQ advanced +7.5%.  However, 2016 did not lift all boats, with typical safe haven equity sectors down, with healthcare finishing down by over -4% and consumer staples ending essentially flat for the year. Meanwhile, U.S. government bonds declined for the second consecutive year.

-December 23rd, 2016 Weekly Market Roundup.  Stock market took a holiday break this week. Volatility dipped below 11 percent on Wednesday, the lowest the VIX index has hit since August 2015, and all three major indexes moved by 0.3 percent or less. Global equities dipped modestly this week while US indices barely budged.

-The U.S. Federal Reserve raised interest rates on Wednesday the 14th by a quarter point, or +0.25%. The Federal Open Market Committee raised its target range from 0.25 percent to 0.50 percent to a range of 0.50 percent to 0.75 percent. The overnight funds rate currently sits at 0.41 percent.  Committee members lifted their expectations for GDP growth from 1.80 percent in 2016 to 1.90 percent, and 2.1 percent in 2017 against the previous estimate of 2.0 percent.  The Fed continued to describe that pace as “gradual,” keeping policy still slightly loose and supporting some further improvement in the job market. It sees unemployment falling to 4.5 percent next year and remaining at that level, which is considered to be close to full employment.

-December 9th, 2016 Weekly Market Roundup. The recent market rally resumed with stocks recording their best weekly performance since the presidential election.  On Friday, the Dow Jones Industrial Average, S&P 500® Index, NASDAQ, and Russell 2000® all reached new record highs. In contrast, safe haven dividend income areas that have outperformed in recent years – including Utilities and Food & Beverage, and Household Products stocks – have fallen since the election.  Likewise, bonds continue to drop in value as investors anticipate an environment with higher growth and higher inflation; long-dated fixed income investments are less attractive under these conditions.  In this environment, our Model Portfolio and Growth Portfolios are faring well, but the retiree income portfolio remains lackluster.  Looking under the hood in equity sectors show a different picture than what is discussed by the media. For example, the health care sector is down -3.7% ytd, consumer staples sector is only up 2.0% ytd, large growth stocks are only up 3.0% ytd, while REITs have lost about -3% these past three months. Moreover, the long-term corporate bond is down -7.3% over the past three months, US Core Corporate Bond has lost -3.2% in the past 13 weeks; government bonds are down -3.8%.  The takeaway is we have short-term rotations going on with sharp differences between winning and losing sectors and asset classes.  For example, financials are up over 22% this year, with basic materials and energy also both up over 20% this year – these are being driven by the perception that Trump will pour a trillion dollars in America’s infrastructure, including a wall. However, all this spending needs approval and Trump has shown that he sometimes exaggerates on what he wants to do versus on what he can do – such as getting a trillion dollars from congress. Hence, the bifurcation in sector performance may not have legs and sector rotational trends may recalibrate and normalize in the intermediate-term. Again, big sector winners are offsetting the anemic returns in what many consider to be the more stable equity sectors.

-December 2nd, 2016 Weekly Market Roundup. Equity markets retreated this week as the post-election rally stalled, with the S&P 500 finishing down -1.0% while the Russell 2000 lost -2.5%. The Barclays U.S. Aggregate Bond Index lost -2.4% in November to mark its worst drop in 10 years due to the strengthening U.S. economy (expected Fed increase), rising oil prices and the prospect of increased government spending under the Trump administration (more debt). The upcoming Italian election (called the referendum) could make it a tough trading period for the US markets on Monday (Sunday for EU). If the referendum is lost, it could prove a catastrophe for Italian bank shares and perhaps bank shares all across Europe.

Post

Investment Insights & Financial Facts for the Month of November

-November 25th, 2016 Weekly Market Roundup. Equities continued their post-election rally as major indexes reached record highs Friday and have risen in each of the past three weeks.  The S&P 500 Index finished the quarter with a gain of +3.9%. However, the performance gap between the best-&-worst-performing sectors during the quarter was more than 16%. Information technology, financials, and industrials were the strongest performers, delivering gains of +12.9%, +4.6% and +4.1%, respectively. The telecommunications services, utilities, and consumer staples sectors were the poorest relative performers, posting losses of -5.6%, -5.9% and -2.6%, respectively.  Hence, the latter sectors are largely viewed as dividend income, which took it on the chin. However, it is essential to be mindful that dividend income is a critical component of the S&P 500’s historical total return, contributing about 40%.

-November 18th, 2016 Weekly Market Roundup. The S&P 500 index gained 0.8% for the week while the Nasdaq Composite (+1.6%) outperformed after lagging one week ago. Conversely, the Dow Jones Industrial Average (+0.1%) underperformed after showing relative strength during the election week. In contrast, typically more stable areas of the market, including high-dividend stocks (including UtilitiesFood & Beverage, and Household Products), declined. The market’s immediate Trump related focus will be on potential tax reform that, by some estimates, could boost corporate earnings by as much as 10%, followed by growth policies, infrastructure investment and the potential of allowing US companies to repatriate cash at a slashed 10% rate. Fed Chair Janet Yellen remarked Thursday, in her testimony before the Joint Economic Committee, that the U.S. economy is strong enough to withstand a rate hike, which could come “relatively soon.” Global bond markets continue to be driven by heightened inflation expectations. The yield on the bellwether 10-year U.S. Treasury, which moves in the opposite direction of its price, climbed to 2.34% on November 18, its highest level in more than a year.

-The current U.S. stock market trading trends have been unusual and a bit bipolar. For example, there has been odd sector rotation, where just yesterday (Nov 16th) more than 300 securities on the New York Stock Exchange hit 52-week highs, while more than 300 securities also hit 52-week lows.

-A recent Wall Street Journal article argues that Donald Trump’s presidency may cause a big downturn in the US real estate market and thus REIT investments. Trump is forecasted to boost growth and cause inflation, but it might be the impact that he has already had which will be the biggest factor for mortgage markets—higher rates. 30-year mortgage rates have already jumped 25 basis points since his election, and the higher interest rates which are expected to accompany his presidency could well cool the real estate market by putting currently lofty prices out of the reach of many borrowers. Prices have risen so much over the last few years in part because big mortgages were affordable compared to incomes as a result of really low rates.

-As a result the Trump Tantrum, the capitalization of a global bond-market index slid by $450 billion Thursday, a fourth day of declines that pushed the week’s total bond losses above $1 trillion for only the second time in two decades, via Bloomberg. In addition, Bank of America Merrill Lynch data showed the 30 year yields jumped (bonds dropping) the most this week since January 2009, and the week is not over yet. Trump’s policies are expected to see inflation trending upwards over the coming years which is traditionally bad for bonds. Other income plays have also been hard hit – For example, RIETs have sold off and dividend equity sectors like Utilities and Consumer Staples are also down for the week. In turn, certain equity sectors rallied strongly on the Trump win such as basic materials (related to the Trump infrastructure investment initiative) and financials (expectation of higher rates, bringing greater profit spread for banks), healthcare, among others.

-Trump pulled off a surprise victory last night with the equity futures turning down in the -4.o% range.  However, this morning the US equity indices are relatively steady, given certain sectors are offsetting losses in others.  For example, Healthcare, Industrials & Financials are actually rallying.  The S&P 500 has been teetering between -0.5% to +0.30 so far this morning.

November 4th, 2016 Weekly Market Roundup. Equity markets closed lower across the board for the second straight week as all major indices and economic sectors retreated; the S&P 500 finished the week nearly -3% below its record high reached in mid-August. The S&P’s weekly loss marked the ninth consecutive day of declines for the S&P 500 Index, the longest stretch since December 1980. This statistic seems ominous on the surface, but surprisingly stocks historically have generally increased after similar declines, rising on average by 7% over the following six months. On the economic front third quarter’s GDP report came in at a better-than-expected 2.9% – this growth rate has not seen since the third quarter of 2014. The Federal Open Market Committee (FOMC) left rates steady at its November meeting but strongly indicated that a hike is likely at the next meeting in December.

-The S&P 500 just completed seven (7) straight days of market losses. This level of daily losses is similar to the longest loss run in the past two decades (which was during the market crash of 2008), where the equity index fell for eight straight days. Fortunately, the difference between now and 2008 was back then the fall was far more steep and violent.

-“Going back 88 years, when stocks advance in the three months before the election, the nominee representing the party in the White House almost always wins (Hillary). When stocks are down in that period, the candidate challenging the incumbent party usually triumphs. Thus it can be said that the Standard & Poor’s 500 index has correctly predicted 19 of the past 22 presidential elections” according to a recent Barron’s piece. Now consider that the S&P 500 has fallen more than 4% since the start of August.

Post

Investment Insights & Financial Facts for the Month of October

-October 28th, 2016 Weekly Market Roundup. Stock indexes were mixed on the week as the Dow Jones Industrial Average increased marginally, while the S&P 500 fell as the upcoming U.S. elections weighed on sentiment despite generally better-than-expected corporate earnings and economic data/ The initial estimate of third quarter GDP (2.9%), the strongest pace in two years, exceeded both the 2.5% forecast and the second quarter’s somewhat anemic 1.4% growth rate. Of the 293 companies in the S&P 500® Index that have reported results, 73% have exceeded analysts’ earnings per share estimates and 57% have exceeded analysts’ sales estimates.  For the quarter, overall corporate sales are now expected to grow 2.7% while earnings are expected to grow 1.6%.

October 21st, 2016 Weekly Market Roundup. The S&P 500 rose +0.4% this week while the Dow Jones Industrial Average finished little changed after declining -0.1%; the Nasdaq Composite gained +0.8%.  Sixty-eight of the 82 companies in the S&P 500 reporting earnings posted better than expected profits for the quarter. However, portfolio managers are hoarding cash at levels not seen since 2001, indicating that in the event professionally managed money have higher conviction, then there remains substantial sideline cash to move the markets on upward. Clearly, investors are sitting on cash for news from the Federal Reserve and the U.S. presidential election. Also, for the first time in three years, trading volume in October is on track to fall below average daily volume for the year.  Federal Funds futures, used by traders to indicate the odds of a central-bank policy change, suggest a 70% chance of a December Fed rate hike. 

-October 14th, 2016 Weekly Market Roundup. In the U.S., the S&P 500 Index lost about 1.0% for the week, its second consecutive one-week decline. European equities, meanwhile, eked out a 0.1% gain (in local currency terms), after falling to a two-month low on October 13. U.S. equity markets were largely calm with the exception of Tuesday, when the Dow dropped 200 points. For the sixth quarter in a row, compntanies in the S&P 500 are expected to post lower profits than they did a year ago, according to FactSet.

-With correlations between mainstream asset classes increasing this year, more diversity is required. Stocks, bonds, oil, and gold are all set for simultaneous gains this year for the first time since 2010.  What is concerning is if these upward correlations would be matched with equal declines among this group should the market correct downward.  This is one of many reasons why our client portfolios require greater asset diversity.  For example, alternative assets are a portfolio diversifier because they don’t have a high correlation with stocks or bonds and fit somewhere between the two in terms of risk profile. Another consideration is to evaluate the increased portfolio contribution of alternative assets when traditional assets like stocks and bonds are trading at lofty valuations.

-October 7th, 2016. Markets declined modestly for the week despite stronger than expected vehicle sales and manufacturing data. Third quarter earnings season begins next week with AlcoaCSXDelta Air Lines, and JPMorgan Chase scheduled to report.  For companies in the S&P 500® Index, analysts estimate a 2.1% earnings decline, the sixth consecutive decrease.

-Since the presidential election can still throw a curve a ball and with both the stock and bond market valuations trading at above average levels, we strongly believe that investors should stay diversified across a variety of asset classes. Indeed, Mr. Market can also be disrupted by the Fed, which is contemplating a rate hike, while the impact of Brexit still looms (Deutsche Bank is just one of the many concerns).

-The S&P 500 index has gained an average of nearly 4% during the fourth quarter since 1945. Even more comforting, the S&P 500 has increased in price more than 70% of the time. Source: CBSNews.com

-It is unusual that the past two months, August and September, produced identical returns in the S&P 500 of -0.12% decline with both months reflecting a lack of investment conviction. For example, the month of August contained many low volume and low volatility sessions, while September was generally a much more volatile month with big intra-day swings in the middle of the month that ultimately made no advancement in returns.
 
-Since 1933, during the month prior to the election, the S&P 500 Index gained an average of 1.7% when the incumbent party won an election. When the opposition party won, stocks declined by 4.4%.

Post

Investment Insights & Financial Facts for the Month of September

-September 30th, 2016 Weekly Market Roundup. The S&P 500 gained 0.2% for the week, but shed 0.1% for the month. The benchmark index advanced 3.3% during the third quarter, underperforming the Nasdaq (+0.8%), which climbed 9.7% in Q3 and gained 1.9% in September. Technology sector stocks had a particularly good quarter.  Economic growth in the second quarter was revised slightly higher by the US Bureau of Economic Analysis.

-September 23rd, 2016 Weekly Market Roundup. Markets rallied this week, with most of gains delivered after the Federal Reserve decided to delay its next rate hike until at least December – even though there was no rate change expected – as well as expectations for a slower pace of future rate increases.   All the major stock indices gained, with small and mid-cap indices outpacing large caps as investors favored more aggressive investments. One thing to keep in mind is the stock market doesn’t like election uncertainty, which is one reason why stocks have increased an average of 2.8% in the two months following past presidential elections.  Next week, OPEC and non-OPEC members meet in Algiers to discuss oil market conditions and the possibility of a production freeze agreement.

-The Federal Reserve’s Federal (FOMC) changed no policy rates and it kept its policy concerning its balance sheet unchanged this week.  But they sent clear signals that a rate increase in December is a strong possibility. Three FOMC members (Fed presidents Esther George, Loretta Mester and Eric Rosengren) would have preferred to raise the federal funds rate at this meeting. Janet Yellen indicated Fed member consensus is becoming stretched as the group “struggled mightily to understand each other’s point of view.”  It is our view that any rate increase would be a nominal change (+0.25) and that there would be no long term negative impact on the capital markets.  Further, lending is largely based on the 10-year treasury yield, which is more impacted by supply-demand metrics of the global markets.

-September 16th, 2016 Weekly Market Roundup. Following a modest pullback at the start of the month, stocks have been treading water as investors await next week’s commentaries on monetary policy by Fed Chair Janet Yellen and the Bank of Japan. Equity markets recovered some of the losses seen the prior week despite the rise in market volatility. For the week, the S&P 500 index gained +0.4%, while the Dow Jones Industrial Average was up +0.2%. Small-cap stocks underperformed large-cap stocks with the Russell 2000 index only up +0.3%. In terms of style, large-cap growth stocks outperformed large-cap value stocks. US yields were mixed as high yield credit declined and the yield curve steepened, with yields on longer maturities rising while shorter dated yields posted narrow declines. Meanwhile, European shares ended at six-week lows as Deutsche Bank slumped. 

-Since the current bull market started, there have been 67 instances in which the S&P 500 dropped at least 2% in a given day, according to Bespoke Investment Group. The S&P 500 has then averaged a 1.3% gain in the week following these steep downdrafts.

-September 9th, 2016 Weekly Market Roundup. The U.S. Equity Market fell for the third time in four weeks as fears of rising interest rates globally drove a risk-off tone across capital markets, coupled with European Central Bank’s decision to defend its current monetary policy instead of increasing its stimulus plans as the market expected. The S&P 500 ended the week down approximately -1.7%, also the worst week since late June. The Dow Jones Industrial Average declined -1.6% for the week, while the tech-focus NASDAQ Composite fell -1.8%. Market volatility picked up as the week wore on as broad equities (S&P 500) slid lower by more than -1.6% on Friday, which was the biggest one-day loss since Brexit. Large-cap stocks performed in with small-cap stocks.

-September 2nd, 2016 Weekly Market Roundup. Generally speaking, the market was very quiet. In fact this year, August was an especially quiet month for stocks; trading volumes were among the lowest in decades. The U.S. Equity Market rallied for the week as Friday’s disappointing jobs report dampened expectations of the Fed hiking rates later this month. The S&P 500 added 0.5% thanks to a Friday rally, which took root after the release of a disappointing Employment Situation report for August. The best performing sectors were financials and consumer staples, while the worst performing sectors were health care and energy. Fed Chair Yellen remarked, “I believe the case for an increase in the federal funds rate has strengthened in recent months.” The case must be stronger now.  December implied probability of fed hike improved to 54.2% from 53.6% on Thursday.

Post

Investment Insights & Financial Facts for the Month of August

-August 26th, 2016 Weekly Market Roundup. The U.S. Equity Market ended the week unchanged in another quiet summer week.  The best performing sectors were materials and financials, while the worst performing sectors were health care and consumer staples. Trading activity remained light and price volatility was non-existent. In fact, the broad equity market (S&P 500) has not posted a 1% daily price change in the last 35 trading days. Fed Funds futures place the odds of a September rate increase at 30% (up from 21%) and a December increase at 60% (up from 52%). 

August 20th, 2016 Weekly Market Roundup. Equity markets were essentially unchanged during the relatively quiet trading week as corporate earnings season is drawing to a close, with more than 95% of companies in the S&P 500 having now reported results. Overall, corporate profits declined about 3%, led by an 84% drop in energy sector earnings. However, Energy (+2.5%) was again the best performing sector as the recent rally in crude oil prices continued. The month of August is usually subdued with trading activity, given many on Wall Street choose to vacation during the month.

-August 12th, 2016 Weekly Market Roundup. All major U.S. stock indices rose to new highs on Thursday to mark the first time since December 31, 1999 that the Dow Jones Industrial Average, the S&P 500® Index, and the NASDAQ Composite reached records on the same day. However, by Friday equity markets pulled back to close the week essentially unchanged. With almost all companies in the S&P 500 having reported earnings, 69% beat analysts’ earnings estimates. Energy was the best performing sector as crude oil prices gained 6+% this week due, in part, to speculation that informal OPEC talks in September might lead to an agreement to stabilize production. 

-August 5th, 2016 Weekly Market Roundup. Equity markets started the week lower after stress tests on European banks concerned investors around the world, but a strong US jobs report moved the S&P 500 and NASDAQ to all-time highs by posting its fifth weekly gain in the last six weeks.  The S&P 500 and Dow Jones Industrial average indices both ended the week up approximately +0.4%, The best performing sectors were info tech and financials, while the worst performing sectors were utilities and telecom.

Post

Investment Insights & Financial Facts for the Month of July

-July 29, 2016 Weekly Market Roundup. 2nd quarter earnings continued to outpace expectations with 8-of-10 companies beating consensus estimates. The S&P 500 index was flat for the week, while the Dow Jones Industrial Average fell -0.7%.  Driven by strong corporate earnings, the tech stocks of NASDAQ Composite jumped +1.3% for the week.  The higher beta small-cap stocks outperformed large-cap stocks. In terms of style, large-cap growth stocks outmatched large-cap value stocks. The best performing sectors were tech and health care, while the worst performing sectors were energy & consumer staples. The last week of July was unchanged in the corporate bond market pricing, with spreads remaining static.

-July 22, 2016 Weekly Market Roundup. Markets finished modestly higher to cap-off four straight weeks of gains in the slowest week of trading so far this year. The U.S. Equity Market rose for the week with the S&P 500 finishing up +0.3% on strong corporate earnings and increased M&A activity. Second quarter earnings ramped up this week with 89 companies in the S&P 500® Index reporting results.  Thus far, 126 companies in the Index have provided quarterly updates: 86 (68%) have exceeded earnings estimates while 72 (57%) have exceeded sales estimates.  Large-cap stocks performed in-line with small-cap stocks. In terms of style, large-cap growth stocks outperformed large-cap value stocks. The best performing sectors were info tech and health care, while the worst performing sectors were industrials and energy.

-July 15, 2016 Weekly Market Roundup. After being propelled by on a strong start to the earnings season and better-than-expected economic data, the S&P 500 index is on the verge of posting record closing highs for five consecutive days; a feat that has not been seen in nearly two decades. The S&P 500 has risen 8% since the Brexit fallout. Valuations are now getting frothy and in this pricey market environment, we strongly believe that investors should increase diversity across a variety of asset classes.

-July 8, 2016 Weekly Market Roundup. Markets rose during the holiday-shortened week with positive economic data buoyed investor sentiment, strong employment data and the Fed Reserve’s Minutes on rate hikes showing “prudent to wait for additional economic data before proceeding.”  With this +4% gain in the market over the past two weeks, the S&P 500 closed just below its all-time high. In turn, bond yields continued to drop; the yield on the 10-year U.S. Treasury closed at 1.37%, down from 1.46% last week. The move reflects high domestic & overseas demand for U.S. Treasuries and perhaps its denomination of the USD.

-July 1, 2016 Weekly Market Roundup. The U.S. Equity Market unexpectedly rose for the week as fears of a post-Brexit tantrum failed to materialize. Broad equities staged a dramatic recovery from Monday’s lows, helped by increased M&A activity, after posting three consecutive days of greater than 1% gains. The S&P 500 index ended the week up +3.3%, which snapped a streak of three consecutive weekly losses. This highlights the importance of staying invested through volatile periods because the best days for the market tend to follow its weakest days. However, we continue to suggest preparing for ongoing volatility in the second half of the year by rebalancing portfolios to a more diverse mix of asset classes.

Post

Investment Insights & Financial Facts for the Month of June

-June 26th, 2016. Don’t Panic! After Friday’s sharp sell of -3.5% to 4% in the US markets and over -7% for many international markets, we are closely monitoring equity index futures for Monday’s market open.  The US equity futures markets currently show Monday’s opening to be in the -4% range. We already have solid risk-control portfolio hedges in play, but should next week show extreme negative sentiment that is long-term in nature – as opposed to a short-term jolt – then we are prepared to increase allocations toward treasury bonds, gold ETFs and funds that perform well in negative market volatility. However, right now, it is a buying opportunity. For example, two of our core large liquid fund holdings only lost -0.44% on Friday (but remain up +4.5% year-to-date) and -0.66% (but up +8.7% year-to-date) on Friday; yet, these funds have shown the ability to make money in both down and up markets.  For example, the first fund has returned +16% annually since 2006, made +50% in the 2008 market crash and only had one down year of -3%.  Similarly, the other fund has made 11% annually since 1997 with only one down year in 2011 of -7.2% (yet it made +5.33% in the 2008 market crash and +18% in the three year tech bubble crash of 2000-2003).  I would like to emphasize that we are not in the “panic” advice business, but we do believe in investing with discipline and thoughtfully adjusting portfolio allocations to help mitigate the losses of more traditional assets which will be held long-term.  For example, should next week show a massive “risk off” and investor capitulation (for an extended period), we will attempt to limit losses of assets exposed to the whims of the “Mr. Market” with the mix of diverse assets.

-Britain has voted to leave the EU, catching financial markets by surprise and sending risk assets plunging. While many financial experts have espoused that the Brexit decision is “much ado about nothing,” the reality is there will be long-term effects of Britain’s decision to go it alone and exit the EU. The stock market volatility, already up, will increase, eroding confidence and forcing bad decisions made in haste. The US dollar’s potential rise against the pound and euro would make U.S. exports less competitive, hurting companies and their employees here at home.  The US Capital Markets are currently down around 2.5%-2.7%, the British pound plunged to a 30-year low (currently down of -7%) and Crude is -4.5%, along with most commodities down on due to higher USD.  In turn, safe haven gold jumped to a 2-year high, with the gold ETF (GLD) up +4.5% today. Former Fed Chairman Alan Greenspan just gave an interview and stated that “This is worst period that I recall since I have been in public office, including Oct 19, 1987 when the market dropped -23%.  This has a corrosive effect which is not easy to go away.”  All said however, inasmuch as the S&P 500 is currently down -2.5% for the day, the index has essential reversed back to its long-term standing at its 2,050 support level, where it has shifted around for more than year now.

-June 17th Weekly Roundup Update: All major stock indices and sectors retreated as investor caution prevailed ahead of the “Brexit” vote, pushing the S.&P. 500 index down 0.33% to finish at 2,071.2.  Safe haven assets such as sovereign bonds and gold rose in response.  The yield on the U.S. 10-year Treasury declined to 1.52%.  Fed lowered its recent interest rate projections for the coming years; rather than a potential rate hike in June or July, Fed Chair Yellen noted Brexit risks, global growth concerns, and slow productivity gains as sources of ambiguity regarding the interest rate outlook.

-Janet Yellen did not raise rates.  Yellen cited headwinds to growth including slow productivity gains, an aging population, a weak global economy and sluggish household formation, all of which “could persist over some time.” The Fed reduced its GDP forecast from 2.2% to 2%. Yellen said next Thursday’s British vote on whether to leave the European Union “was one of the factors that factored into today’s decision. Fed fund futures gave just 23% odds of a July rate increase.

-Three key fears seem to have overtaken the markets: 1. worry about upcoming central bank meetings on rates, 2. tension about the global economy as a whole, and 3. anxiety about Britain’s EU referendum next week. The issues have been witnessed as stock prices have been falling and bond yields along with them.

-June 10th Weekly Roundup Update: The U.S. Equity Market closed unchanged on lower trading volumes for the second consecutive week as investors stayed cautiously positioned before the upcoming central bank meetings and “Brexit” vote. The Dow Jones Industrial Average fell 0.8%, while the tech-focused NASDAQ Composite climbed 0.4%. The higher beta small-cap stocks outperformed large-cap stocks. In terms of style, large-cap value stocks outperformed large-cap growth stocks. The best performing sectors were telecoms and energy, while the worst performing sectors were financials and health care.  Equities have yet been unable to break through to new highs, while fixed income continues to offer little in terms of yield.

-June 3rd Weekly Roundup Update: The U.S. Equity Market closed little changed for this holiday-shortened week. The S&P 500 and NASDAQ Composite indices ended the week up approximately 0.1%, while the Dow Jones Industrial Average fell 0.3%. The lack of headlines, with the exception of Friday’s U.S. jobs report, kept a lid on market volatility as broad equity prices (S&P 500) fluctuated in a 1% range.  Friday’s weaker-than-expected jobs report undermined recent expectations that the Fed would be ready to raise interest rates as soon as June if the U.S. economy continued to improve. However, an additional consideration for the Fed is the potential economic fallout from Britain’s June 23rd vote on EU membership (“Brexit”). Hence, these more recent Fed considerations has put a counter spin on Chair Yellen’s comments from last week, when the yield curve was flattened by the headline “Yellen says Fed rate hike in coming months may be appropriate.”

Post

Investment Insights & Financial Facts for the Month of May

May 27th Weekly Roundup Update: US equities finished higher for the week with all major indices generating positive returns above 2% across the board. Firmer oil prices helped, with West Texas Intermediate touching $50 this week. The resilience of the underlying economy to falling energy prices can be seen in the Unemployment Rate, which declined to 3.93% in April, the lowest since September 2008.  US economic output advanced at a still-sluggish 0.8% annual rate, according to the US Bureau of Economic Analysis. Growth in the second quarter looks to be a bit more robust, with growth estimates running around 2.5%.

May 20th Weekly Roundup Update: Despite disappointing corporate earnings results from retailers, broad equities managed to end the week higher as trading activity was robust on back of increased intra-day volatility. The S&P 500 closed the week up approximately +0.6%, while the tech-focused NASDAQ Composite climbed +1.4%. The path to these gains, however, was bumpy, as the S&P 500 recorded average intraday swings of 1.1%. Driving this volatility was the Federal Reserve’s minutes from its meeting in April. The minutes revealed that the committee thinks it may be appropriate to raise short-term interest rates in June if the labor market continues to strengthen, inflation continues to rise at an annual rate of 2%, and economic growth accelerates in the second quarter. Treasury rates rose as a result; the yield on the 10-year U.S. Treasury Note increased to 1.85% from 1.71% last week.  In addition, stock Utilities, which typically attracts investors seeking high dividends in a low interest rate environment, was the worst performing sector; stock Financials, which typically benefits from higher interest rates, outperformed. 

-May 13th Weekly Roundup Update: Markets fell for the third straight week on uneven trading activity.  All major indices fell with the S&P 500® Index returning to breakeven for the year. Driving stocks lower on Wednesday was a batch of poor earnings reports by stocks in the consumer sector, particularly from brick-and-mortar retailers. At the end of the week, nearly 92.0% of S&P 500 components had reported their results. Blended earnings were down 7.0% year-over-year while earnings on a reported basis were down 7.6%. Investors heard from a handful of Fed officials throughout the week with some cautioning that the possibility of a rate hike in June should not be dismissed entirely. The fed funds futures market, however, remains convinced that the next rate hike will not come before December. 

-May 6th Weekly Roundup Update: Markets pulled back for the second straight week on lackluster economic data and mixed earnings results. Since reaching year-to-date highs in late April, major indices have stalled as investors weigh soft economic indicators and four consecutive declines in quarterly earnings for the S&P 500® Index. Indeed, the equity markets sold off this first week of May, fulfilling the “sell in May and go away” trading adage. For the week, the Dow ended down 0.2 percent, the S&P 500 fell 0.4 percent and the Nasdaq declined 0.8 percent. The S&P 500 is up 0.6 percent for the year so far. The BofA Merrill Lynch BB/B cash pay constrained index was down -0.63% this week as spreads widened by 26 basis points to an option-adjusted-spread of +497 basis points. The tone of the past week in municipals was that of stability, despite some high profile events (i.e. first general obligation default in Puerto Rico), and further political discord in the cities of Chicago and Detroit.

Post

Investment Insights & Financial Facts for the Month of April

-April 29th Market Weekly Roundup Update: Markets barely stayed afloat for the week after disappointing earnings results from high profile technology companies put downward pressure on the broader market.  Apple (AAPL), the largest constituent of the S&P 500® Index (2.9% weighting), fell over -11% for the week after reporting its first quarterly sales decline in 13 years. About 60% of the S&P 500® Index has reported financial results with 74% exceeded earnings estimates and 55% exceeded sales

-April 22nd Market Weekly Roundup Update: Markets continued to edge higher on generally better-than-expected corporate earnings results and rising crude oil prices (more on this below).  The S&P 500® Index and Dow Jones Industrial Average have each rallied about 15% from their February lows to reach new highs for the year. However, consensus analysts expect an 8.9% decline in earnings compared to the prior year; these results would mark four consecutive quarters of year-over-year earnings declines for the first time since 2008-2009. West Texas Intermediate crude, the North American benchmark, had gained 8.45% to reach new highs for the year.

-We hold individual bonds to limit interest duration price risk and this also avoids fund management expenses, making it more economic with lower costs for clients. We also only advise on investment grade municipals and corporates with sector/industry diversity within those groups. However, we also allocate to certain bond funds as well.  Why? The first reason is diversification, as the large basket the bond fund provides is more balanced with greater exposure to many bond issues (e.g. less event risk). Second, institutional investors have better access to more bond issues, and at the par issuance value (of which, at times, retail investors can’t even get access). The third reason is tighter bid-ask spreads, as individual bond spreads can be quite wide (e.g. 1-2%), while bond funds (both ETFs and mutual) can trade with very narrow spreads. Fourthly, bond funds typically have more balanced interest rate risk since duration is not constantly decreasing. Finally, bond funds, unlike certain broker statements (but not Schwab), do not misrepresent coupon income, and are thus more transparent.

Improving investor sentiment, helped by a rebound in crude oil prices and an easing global growth concerns, have spurred the strong rally in the second month of April ending 4/15/16.  Markets rose for the week on a better-than-expected start to the corporate earnings season.  In particular, upbeat results from banks buoyed the financial sector and the broader market. Major indices have now advanced seven out of the last nine weeks; the S&P 500® Index and Dow Jones Industrial Average are up 13.8% and 14.3%, respectively, from their mid-February lows.
 
-We custody and work within Charles Schwab Institutional and are not surprised that Charles Schwab received the highest score among 20 full-service investment firms rated by J.D. Power and Associates. The firm scored an 837 (out of 1,000). The 14th annual survey measured responses in January from more than 6,000 investors based on seven factors: financial advisor, account information, investment performance, product offerings, commissions and fees, website and problem resolution.

-Markets declined for the first week of April as questions about the effectiveness of central bank policies weighed on sentiment. As expected, while the bull market is aging and with that, more volatility persists, it is alive. . U.S. jobs and improved wages, among other factors, support our confidence. Additionally, a 7-week long rally from mid-Feb lows climbed the wall of worry. Nonetheless, market volumes remain somewhat subdued as investors await the start of earnings season; the daily trading volume of the S&P 500® Index is roughly 30% lower than at the start of the year. Expectations for the reporting period are relatively modest; overall, forecasts anticipate a 1.2% decline in revenues and a 9.1% decline in earnings.  Continued pressure in commodity-related areas, including EnergyMaterials, and Industrials, account for much of the anticipated earnings shortfall. Financials are also estimated to post earnings weakness due to the low interest rate environment.
 
-What’s helped drive the markets back up?  The good old reliable “Don’t Fight the Fed.” Fed Chairman, Janet Yellen, essentially told Mr. Market that despite inflation being on the rise and employment below 5%, she is not going to raise the Fed Funds rate 4-times this year (which was the initial forecast), nor even two times this year (her later guidance), but rather most likely not at all in 2016.

-Gold Posts Biggest Gain in Thirty Years. The first quarter of 2016 saw a sharp drop in many financial assets, and then massive rally in most risk assets, including stocks. However, despite that rally, safe haven assets held on. Gold is one of those assets, and the commodity has just notched its best quarter in 30 years. Gold rose +16.5% this past quarter, the best three-month period since 1986.
 
-The more risk you take in your portfolio with traditional allocations like stocks is often compensated with higher returns in the long-run. The problem is that riskier, more volatile assets can also cause one to sell or buy at the worst possible time. This is why we recommend most non-retired investors have a portfolio with exposure to both riskier and safer assets.

Post

Investment Insights & Financial Facts for the Month of March

-As hard as it was to believe that the S&P 500 was down more than 10% on the year on 2/11, it was even more unfathomable that by the end of Q1 the S&P 500 would have erased all of those losses and be flat, or even up, on the year at some point before 3/31. Going back and looking at prior years where the S&P 500 saw 10% moves to both the upside and downside in the span of the first quarter, On average, the index has seen a gain of 28.3% (median: +32.0%) for the remainder of the year with positive returns 75% of the time.

-The major averages ended a five-week win streak, with The S&P 500 falling -0.7% over four days that saw some of the lowest trade volume of the year so far; the markets were closed for Good Friday. The stock market’s lower note was partly driven by hawkish commentary from St. Louis Fed President and FOMC voting member James Bullard putting a damper on investor sentiment.  Mr. Bullard said that a rate hike in April is not off the table. U.S. crude oil futures came well off session lows to settle 0.8 percent lower at $39.46 a barrel. The U.S. dollar index pared gains after touching its highest in more than a week, but turned in its first positive week in four with a rise of more than 1 percent. The euro held near $1.118 and the yen was at 112.81 yen against the greenback. Gold futures for April delivery settled 0.2 percent lower at $1,221.60 an ounce, down 2.61 percent for the week, its worst since Nov. 6th. Treasury yields held higher, with the 2-year yield near 0.88 percent and the 10-year yield around 1.9 percent.

-March 18th Market Weekly Roundup Update: Equity markets continued their advance to extend the current streak to five consecutive weeks of gains. The positive momentum stemmed from this week’s Federal Reserve meeting at which Fed Chair Janet Yellen downgraded expectations for rate hikes this year; the Fed now expects to raise rates twice in 2016, down from December’s estimate of four times.  A weaker dollar would also help sustain the recent increase in commodity prices.  West Texas Intermediate (WTI) crude, the North American benchmark, closed above $40 per barrel for the first time this year; prices have jumped more than 50% since hitting a low in early February. 

-Most Investors don’t panic when markets periodically correct: Investors have lost money in the markets this year, but not enough to make them revaluate their portfolios, according to a recent survey of affluent individuals. It would take a 19 percent drop in the equities markets to cause investors to think about changing their holdings and a 22 percent decline to make them sell off their equities, according to a recent Legg Mason Global Investment Survey of 500 affluent U.S. investors.

-March 11th Market Weekly Roundup Update: the Dow rose 1.2 percent, the S&P gained 1.1 percent and the Nasdaq added 0.7 percent, marking the fourth consecutive positive week for the three indexes. The S&P 500 is now down 1.1 percent for the year, staging a sharp recovery from a selloff at the start of the year that was partly driven by a rout in oil. All major indices and sectors rose as investors reacted positively to the European Central Bank (ECB) announcements, improved energy trends, and less volatility in China’s markets. The markets turned enthusiastic about the ECB’s latest stimulus measures.  These include interest rate cuts, an expanded pace and scope of its bond buying program, and cheaper, longer-term bank funding.
 

-March 4th Market Weekly Roundup Update: Markets rose for the third consecutive week as optimism seemed to replace concerns about an economic slowdown, depressed energy and China.  In fact energy stocks surged as the PHLX Oil Exploration and Production Index jumped a staggering 35.3% and the economy was blessed with a robust employment report (242,000 non-farm jobs added versus 200,000 forecasted). After major indices dropped approximately -10% to start 2016, they have since risen to recoup most of their year-to-date losses. The S&P 500® Index and Dow Jones Industrial Average have gained 9.3% and 8.6%, respectively, since hitting their lows on February 11th. What is confounding to most investors trying to time markets is they believe an obvious catalyst will emerge to signal the onset of a market rebound but market rallies are typically triggered by an incrementally few minor events that collectively elevate investor sentiment and these are often identified only after the fact

-Fortunately, the margin spread between government bond yields (treasuries) and corporates has been narrowing over the last couple of weeks, which has driven a rise in corporate bond prices. For instance, the BAML High Yield Index saw spreads drop hugely from a peak of 887 basis points (8.87%) on February 11th, to 768 basis points by the end of February. Another thing to consider is that the bull market was fuelled in part by big corporate stock buybacks, which have been funded by debt. That means that in order to continue, the debt markets must be cooperative for companies to issue debt for stock buybacks. Institutional investor leadership in the equity marked are aware of this mechanism with their allocation decisions toward stocks, which to no surprise, have also been recovering as well.

For the month of February, the Dow rose +0.3%, the S&P 500 lost -0.4% and the Nasdaq lost -1.2%. The financial sector continued to struggle, ending the month down -12% year to date. For once, the catalyst for the decline was not oil, as a barrel of crude rose +3% for the session.  However, concerns over the slowing economy in China contributed to a late selloff. Gold closed February with a gain of more than +10%, the most for any month in four years. U.S. Treasuries prices also showed a second month of gains. The euro hit $1.086, its lowest against the dollar since the start of the month, after consumer prices in Europe fell again.

Post

Investment Insights & Financial Facts for the Month of February

-Feb 26th market weekly roundup update:  On the heels of U.S. crude oil prices gaining over 3.5% and with second estimate for fourth quarter GDP increasing to 1%, US equity markets gained for the second straight week as concerns of a potential recession eased.  Most major indices are on track to post gains for the month with markedly reduced volatility; the results are a stark contrast to the turbulent 5+% decline in January. Another economic data set was also positive with new and existing home sales activity, while volatile, continued its trend upward. 

-Feb 19th market weekly roundup update:  The markets had the best weekly gains since November with the S&P 500 rallying more than 6% from its low last week to its recent high this week. Although the S&P 500 is still down -5.85% for the year, it is encouraging that oil’s lower and stocks aren’t cratering.  That relationship has to be broken down for this to be a sustainable rally. A rebound in the year’s most beaten-down areas, including technology, industrials, and consumer-oriented sectors, suggests that investors are beginning to look for bargains in deeply oversold stocks. Meanwhile, stock and index short covering activity likely contributed to the weeks biggest gains, namely Tuesday’s and Wednesday’s market strength; reports indicated these were the largest short covering days since October 2014.

-According to the Bureau of Labor Statistics, in the past 50 years, every recession has seen the number of jobs in the economy decline by at least 1%, and have never declined by that much outside of a recession. Today, the number of jobs in the U.S. has been growing briskly—up 2.7 million in 2015.

-According to FactSet, despite average intra-year drops of 14.2%, annual returns have been positive in 27 out of 36 years for the S&P 500 since 1980.

-According to an Allianz study, 92% of Americans working with a financial advisor say that person is helping them reach their financial goals and 86% say their advisor relieves the pressure of trying to plan their family’s financial future by themselves.

-Large institutions and sovereign wealth funds, who borrowed in euro and yen, have been selling riskier assets, and are now buying back those currencies, undermining central bank efforts.

-Feb 12th market weekly roundup update:  Equity Markets closed lower for the second consecutive week despite Friday’s rally amidst continued investor anxieties about the fallout concerns over the health of financial companies, the effectiveness of central bank policies, lingering low oil prices and a slowdown in China. Meanwhile, U.S. Treasuries rallied in the week’s predominantly risk-off environment, benefiting from strong demand for safe-haven assets. The yield on the bellwether 10-year note, which began the week at 1.86%, fell to 1.63% on February 11th.

-The US Equity Market Correction started with China, pushed further by commodity related declines and has now taken down much of the financial sector with concerns of loan exposure to energy and other commodity weakened industries. More recently, the weakness was centered on large cap technology stocks, the clearest sign that investors have started to shift to “risk-off” on more aggressive portfolio holdings. Nothing we have witnessed in recent days leads us to conclude that the current correction has run its course.

-The potential impact of the downside is a critical consideration. Investment strategies that seek to generate more consistent returns and less severe drawdowns may offer investors a higher likelihood of maintaining their investment plan. Asset allocation is vitally important. The benefits of diversification can be powerful and robust, not just in terms of volatility reduction, but also for return enhancement. We recommend multi-asset diverse portfolios: when we construct an investment portfolio using multiple asset classes, one finds that portfolio volatility is less than the weighted average of the volatility levels of its components. This occurs as a result of the dissimilarity in patterns of returns among the components of the portfolio. We will call this advantageous reduction in portfolio volatility the multi-asset diversity effect.

-Feb 5th market weekly roundup update: Markets sharply dropped to snap two consecutive weeks of gains as soft economic data weighed on investor sentiment. Volatility continued due to persistent concerns about tepid global economic growth, some earnings disappointments and growing fears of a potential recession. All major indices fell for the week, with the technology-heavy NASDAQ Composite losing over -5%. Our portfolios largely remain defensive,with healthy balance sheet stocks in defensive sectors (consumer staples, health care, utilities, etc.) that clip large growing dividends, stable company bonds with investment grade ratings, investment grade municipals, alternative managers that benefit or can withstand volatility, etc.

-Active fund managers welcome return of volatility. Active funds have outperformed passive funds in Europe and US in 2007, 2009 and 2010 when volatility spiked. Active management often enables flexibility for managers to harbor assets in safer asset classes and provide opportunities for investing in areas where fear has been overplayed.

-Weakness in financial equities continued to build with 55 stocks above a $5 billion market cap recording new 52 week lows on Wednesday, Feb 3rd.  Much of the sell-off concern has been driven by large bank exposure to energy loans, higher credit losses related to China’s impact on global economy and overall lower capital market activity for investment banking.

-Starting to see a pattern of capital migration back towards the US treasury market which has pulled long term US treasury yields back below multi-month support levels. With capital moving toward a “flight to safety,” the US 10 year yield currently trades at a yield of 1.89%, the lowest seen since last April. The flattening of yield curve case would be symptomatic of weakness in credit markets that has already been revealed by widening spreads

-Monetary policies currently are asymmetric. If the Fed tried to do another round of QE and/or negative interest rates, the evidence is overwhelming that such actions will not make things better. However if the Fed wishes to constrain economic activity, to tighten monetary conditions as they did in December – then those mechanisms are still in place.

-U.S. equity markets stumbled out of the gate in 2016. With the exception of Utilities, sector performance was negative across the board. In particular, materials and energy struggled.

Post

Investment Insights & Financial Facts for the Month of January

-Stocks ended the week sharply higher with a Friday surge, capping two consecutive weekly gains for the month.  Markets were boosted by Japan’s surprise interest rate cut, pockets of encouraging earnings reports, a better-than-expected Chicago PMI report and some stabilization in oil prices also helped push equities higher.  Nonetheless, even after this week’s rally, the equity markets posted worst January since 2009 with S&P 500, falling -5.07% for the month.  Much of the prolonged market’s negative sentiment has been directed at China.

-History shows it doesn’t take very long for market corrections (declines of greater than 10% but less than 20%) to reverse and return to prior peaks. The mean time to market recovery has only been 107 days. According to investment firm Deutsche Bank, on average, the stock market has a correction, defined as a drop of at least 10% or more from its recent high, every 357 days—or about once a year.

-It makes more sense to stay committed to an investment plan of diverse assets rather than try to guess the best time to be in the market. Over the past  66 years, there have been 13 bear markets, lasting an average of 14 months and declining a total of 24.6% before recovering. By contrast, the 14 bull markets since 1949 have lasted roughly a multiple of over 3x longer, or 44 months on balance, each growing an average of +117.3%.

-The equity markets ended up with sharp 2%+ increases on Friday with positive developments, including
early corporate earnings results, economic data, and supportive central banks comments, all which helped turn the receding tide. The strong Friday finish for the equity markets during the holiday-shortened week helped offset the sting of two turbulent weeks of decline; however, S&P 500, Dow and Nasdaq all remain down -6.6%, -7.5% and -8.3% year-to-date, respectively.

-Equity markets tumbled on Friday Jan 15th to end a second straight week of sharp declines. The S&P 500 Index joined other major indices in starting the tumultuous year with downward moves toward
correction territory. Investors knee-jerk reaction of “sell-first, ask-questions-later” is a sentiment that has turned excessively negative, with the S&P down -7.83% YTD and the NASDAQ down -10.36 for the year.

-Oil prices have dropped about another -20% this year and this has impacted the S&P 500 and bonds given their high exposure to energy corporates. However, higher dividend yield stock sectors that we currently overweight for equity allocation, such as utilities, are only down -0.21% for the year. Continued worries about falling crude oil prices and weakness in both China’s currency and its stock market contributed to the malaise, being down over -20% from its late December high – entering bear market territory. Nonetheless, China’s manufactory-driven economy has yet to show evidence of a “hard-landing” given the overcapacity, real estate bubble, excesses of investment and exchange rate pitfalls.

 -As the year unfolds, we look beyond macroeconomic headlines and seek out bright spots across the investment landscape stand to benefit. We continue to increase allocations to strategies that benefit from negative market forces of prolonged market volatility as downward market trends persist; marked by signals of investor capitulation related to China-Oil-ISIS-Fed worries. For example, one of our liquid tradable manager strategies benefits from market weakness and volatility and returned +50% in 2008; this fund had a +16.o% annual inception return since 2006 and returned +7.74% in 2015; the liquid tradable holding is also up YTD 2016 (as of Jan 15). This asset class category of funds all have daily liquidity and are tradable within our Charles Schwab Institutional platform.

-Art Cashin recently shared a powerful data point “Jason Goepfert, the outstanding pilot of SentimenTrader dug into his incredibly extensive files to uncover a rather rare condition. He noted that the indices have had two 10% corrections in a rather short span. That has only happened three times in the last 100 years. Unfortunately, those occurrences were in 1929, 2000 and 2008. As you may recall, those were not particularly good years for the bulls.”

-Inasmuch as we have forecasted the current volatility in 2016 with higher frequency and greater magnitude, and also positioned our client portfolios for this current environment, it is important for investors to remember that there has been a lot of volatility and plenty of sharp corrections, even bear markets, over the course of the past two decades. From the peak in 2000 to its trough in 2002 the equity markets tanked by almost -50%. On October 19, 1987 (a.k.a. Black Monday), the market plummeted by more than -20%. Due to the financial crisis starting in 2008, by March 2009 the S&P was down almost -60% from its 2007 apex.  And during the past 25 years the S&P 500 has fallen by more than -8% at least once over a three-week period in the large majority of calendar years. It happened even four months ago as recently as August 2015. It has happened in 2011, 2010, and several times during the most recent financial crisis about eight years ago. It has happened in 2003, multiple times in 2002, and frequently in 2001.
 
-Fed Rate Rise Calls Evaporate as Markets Plunge. The Fed made clear their rate guidance with “liftoff” with an anticipated four more 25 basis point increases this year.  But U.S. interest rate futures markets show barely two rate hikes priced in for this year. According to former Bank of England policy maker and Economics Professor at Dartmouth (Blanchflower), “The markets don’t believe the Fed. I said at the time of the December raise it was a mistake and gave a 50/50 chance that the next move would be a cut.”

The -4.93% YTD decline already for the S&P 500 is actually the worst 4-day start to a year in the index’s history since 1928. The week’s market upheaval is more about emerging markets than developed markets and more about global currency mechanisms than credit/debt issues.  However, investors should have safeguards in place for portfolios and have adaptive investment strategies in place given the whipsaw of market sentiment. One of the reasons so many investors fail is because they make poor decisions when markets fall.

-We forecast a modest positive environment for 2016 with tepid U.S. economic growth in light of the strong U.S. dollar headwinds on exports and U.S. corporate global exposure, also weighed down by the energy industry’s dismal outlook and China’s troubles reverberating into core goods and services. More specifically, we look for the S&P 500 to return low single digits with elevated market volatility in 2016. Our investment strategies for 2016 will include more allocation exposure to benefit from both volatility and the prospects for only marginal potential equity market returns.  We also foresee market corrections, periods where the equity markets recede -10%. This type of pullback has occurred as recent as the month of August 2015 and with a typical frequency of about every 18 months or so.

-Asset allocation is vitally important. The benefits of diversification can be powerful and robust, not just in terms of volatility reduction, but also for return enhancement. We recommend multi-asset diverse portfolios: when we construct an investment portfolio using multiple asset classes, one finds that portfolio volatility is less than the weighted average of the volatility levels of its components. This occurs as a result of the dissimilarity in patterns of returns among the components of the portfolio. We will call this advantageous reduction in portfolio volatility the multi-asset diversity effect.

-As one investment leader puts it (Gibson), ‘the multiple-asset class strategy is a tortoise-and-hare story. Over any one-year, three-year or (intermediate-term) period, the race will probably be led by one of the component single-asset classes. The leader will, of course, attract the attention. The tortoise never runs as fast as many of the hares around it. But it does run faster on average than the majority of its components, a fact that becomes lost due to the attention-getting pace of different lead rabbits during various legs of the race…  Yet the tortoise, in the long run, leaves the pack behind.  And in case the analogy was lost on anyone, the hare is the single-asset class (such as just pure) domestic stocks, for instance – whereas the multiple-asset class is the tortoise.’ 

-The auto investment services called Robo-Advisors like Betterment and Wealthfront apparently did not serve their investors well in 2015.  Research analyst Meb Faber said all four of the Robo-Advisors “likely lost money in 2015, with Betterment losing between 0.28 percent and 3.16 percent, depending on the allocation model, and Wealthfront losing between 1.08 percent and 4.59 percent. This isn’t surprising considering most assets performed poorly in 2015, yet inexperienced investors complained on social media. “People [who] flip out about being down 5 or 10% don’t understand these portfolios have lost 30 to 50% historically!” Faber said

-S&P 500 finished the 2015 year with its first loss of -0.7% since 2008, yet still eked out a +1.38% positive overall total return with dividends. The S&P was weighed down by significant falls in the oil and materials. The Dow Jones returned +0.21% and US Corporate Bond Index finished down -0.46%. US Corporate High-Yield bonds lost -4.5%, according to the Barclays index, while Brent crude tumbled -35% over the year from $57.33 to below $37.28 a barrel; high yield bond exposure to energy was a determent. Spot gold dropped -10% with copper falling by -25%. In a year of US dollar strength the dollar index rose +9% while the euro gave way to a -10% decline, falling from $1.21 to about $1.09. The Brazilian currency (the real) stood out as the biggest decliner, down -33% against the dollar, hurt by a weakening of its commodity driven economy and political risk.

-While unemployment itself has looked good enough and there has been some wage growth, the labor force participation is at 62.5%, which is essentially its lowest mark since 1977.

Post

Investment Insights & Financial Facts for the Month of December

-True Cost of Financial Advice: Merrill Lynch Most Expensive.  Investors are often unaware how much they pay for financial advice, but the difference over 30 years of investing among different brokerages can amount to close to half a million dollars, according to a survey cited by WealthManagement.com. The most expensive advice comes from Merrill Lynch, which charges an average combined total of 1.98%.  TD Ameritrade is also amongst the most expensive as far as just advisor fees, with 1.53%.

-For the week ending Dec 18th, the anticipation surrounding the Fed’s decision boosted stocks early in the week, but the equity markets ultimately turned lower on continued worries over crude oil prices and a strengthening dollar’s impact on US trade.  In addition, Friday’s expiration of various options and futures, commonly known as “quadruple witching,” created additional market volatility. 

-The Federal Reserve raised interest rates for the first time in almost a decade in a widely telegraphed move while signaling that the pace of subsequent increases will be “gradual” and in line with previous projections.  This was a positive signal of confidence by the Fed in the economy, which resulted in a global rally. The Federal Open Market Committee also unanimously voted to set the new target range for the federal funds rate at 0.25 percent to 0.5 percent, up from zero to 0.25 percent. Policy makers separately forecast an appropriate rate of 1.375 percent at the end of 2016.

-For the close of the 2nd week of December, markets declined sharply in reaction to tumbling commodity prices in the run-up to next week’s Federal Reserve meeting.  All major indices and sectors fell; not surprisingly, Energy was the worst performing sector. High yield (or, “junk”) bonds have come under increased pressure as the effect of rising rates adds to the price declines caused by investments in commodities and emerging markets.  This past week two high yield bond funds were forced to close as they were unable to meet redemption requests.  Notably, fixed income investments, in general, are far less liquid than stocks.


-Growth remains at a moderate positive pace of +2%-2.5% for the first three quarters of 2015. And real final domestic purchases were over 3% in the 3Q. This suggests that consumers continue to spend and businesses are investing.

-World equity markets proved resilient in November with global equity markets gaining 0.7%.  A key date in many investors’ diaries is the Fed meeting on 16 December. After a decent string of US economic data—including a robust jobs market report for October— the conditions would finally appear to be in place for the Fed to feel confident lifting rates from the zero-lower bound. Globally, the Christmas period is usually a good time for equity market performance. Looking back over the last two decades the MSCI AC World Index has risen by 1.8% on average in December.

-Going back as far back as 1928, December is the only month that has never resulted in the worst performance of any given year, according to data from Oppenheimer Asset Management and Bloomberg.

Post

Investment Insights & Financial Facts for the Month of November

-The third week of November results: Markets demonstrated resilience in the wake of last week’s terror attacks in Beirut and Paris. U.S. markets posted their strongest session in three weeks, with all 10 major S&P 500 sectors trading higher. Our outlook for the global and U.S. economy have not changed based on the events.

-The second week of November results: Markets fell sharply to snap six consecutive weeks of gains.  All major indices posted broad-based declines, with consumer and energy stocks leading the underperformers.  The retail sector, in particular, came under pressure following poor earnings results. Market volatility will likely persist so long as investors remain wary of the near-term outlook. 

-The first week of November results: Markets rose for the sixth straight week as generally positive economic data and a flurry of M&A news boosted investor sentiment.  All major indices gained; the Dow Jones Industrial Average once again turned positive for the year.

-Both the SEC & FINRA has issued Investor Alerts on automated investment tools like Robo-Advisors: “While automated investment tools may offer clear benefits—including low cost, ease of use, and broad access—it is important to understand their risks and limitations before using them. Investors should be wary of tools that promise better portfolio performance. .  Be aware that an automated tool may rely on assumptions that could be incorrect or do not apply to your individual situation. In addition, an automated investment tool, like other investment programs, may be programmed to consider limited options. For example, an automated investment tool may only consider investments offered by an affiliated firm.”

-To recap October, the S&P 500 picked up +8.3% last month, registering its best monthly return in four years.  The performance of U.S. stocks this year has uncannily mirrored the pattern of the market’s performance of 2011, when the S&P 500 experienced a correction and finished the year virtually flat.  All the known market risks are still present, including China, Greece, Fed, Valuations, Oil and Earnings.

Post

Investment Insights & Financial Facts for the Month of October

-U.S. economic GDP growth has trucked along in the 2% range with low rates of unemployment; but job growth is still limited to service sector jobs which pay lower wages. Reported inflation has been muted and commodity prices have largely be in free fall. The Federal Reserve is poised to nudge interest rates, but has deferred making the first increase given fragile global economic pressures.

-Early indications from the third quarter earnings season point to resilient corporate profits despite concerns about global economic growth.  Of the 58 companies in the S&P 500® Index that have reported results, 81% exceeded EPS estimates while 50% exceeded sales estimates.  Still, earnings are expected to decline for a second straight quarter.

-The analysis by Envestnet found advisors beat market benchmarks by an average of +3% a year. Tax benefits alone provided by financial advisors added up to more than +1% over the broad market annually from 1994-2014.  A further +0.44 of added value came from regular rebalancing of a portfolio.  Other outperformance attributes included asset allocation and fund/security selections.

-To help reduce portfolio markets risks, investors often turn toward “safe haven” assets such as government bonds and exposure to the US dollar (e.g. safer US markets versus their riskier counterparts) and/or shifting their allocations weightings toward defensive stocks versus cyclicals. However, we have been seeing correlations rise between equities and the traditional perceived “safe haven” assets. For this reason, we believe that for multi-asset portfolios are a more effective tool to mitigate volatility, particularly in a market environment where conventional asset allocation views on “safe haven” assets is changing. In short, true diversification comes from an unconstrained approach to multi-asset allocation.

– Quality company stocks matter!  One study, Novy-Marx’s 2012 “The Other Side of Value: The Gross Profitability Premium,” showed that profitable firms generated significantly higher returns despite having higher valuation ratios.  In addition, in a late 2013 PIMCO paper by Gordon and De Rossi, “The Profitability Premium in EM Equities,” PIMCO showed that profitability tends to be persistent and underpriced.  There is a profitability premium for investors to capture.  Though we select individual quality stocks, we also use these exchange traded funds (ETFs): We invest in a variety of domestic high quality ETFs including Vanguard Dividend Growth (VIG), iShares MSCI USA Quality Factor (QUAL), ProShares’ S&P 500 Aristocrats ETF (NOBL), Wells Fargo Adv Glo Div Opp Common (EOD) and Global X ETF SuperDividend (SDIV).

-Certain stock sectors outperform others when Fed rate increases (expected in Dec) and these include: large established technology, financial and consumer oriented business entities. Consider these equity sectors for overweigh allocations as rates increase.

-The S&P 500 lost -2.6% over the month of September 2015 and dropped -6.9% over the last quarter.  There has been a flight to safety in stocks toward megacap blue chip stocks.  We have been overweight large stocks with sold balance sheets that operate profitably and have a history of dividend growth.

Post

Investment Insights & Financial Facts for the Month of September 2015

-Yellen’s FOMC forward looking rate guidance statement was not as hawkish as expected with keeping “Considerable Time.”

-Central banks (e.g. Fed Reserve, European Central Bank, etc.) are less likely to effectively contain volatility and markets need to price-in these considerations.  For example, according to one of the leading investment strategist in which we turn to, El-Erian: “The broker-dealers have gotten smaller and will continue to get smaller. The end users have gotten bigger.  People actually believe that they can rationally bubble ride until the turn. When the turn comes, they actually believe they’re going to reposition themselves. History tells us that there isn’t as much liquidity as people think there is.”  In our view, this is one of the reasons why the Fed’s pathway for rate increases will ultimately be very deliberate, cautious and in the smallest increments.

-Online advisory firm Personal Capital examined anonymous data from 155,924 of its users to investigate the true client costs from both advisory and fund-related fees across 11 brokerage firms. The biggest offender was Merrill Lynch, which would cost the average $500,000 account $936,390 in fees over 30 years of investing, assuming annual returns of 7 percent and fees that remained consistent over that time frame.

-The China-related sell-off has likely been exacerbated by trading halts, liquidity pressures (ETFs) and systematic investing programs; China represents a mere of 0.7% of U.S. GDP. Markets recovered later in the week as investors viewed conditions as oversold. The energy, technology and consumer discretionary sectors led the way while utilities sold off sharply. Since 1950, the US has seen nine (9) bear markets and 10 recessions. And almost all of these bear markets have overlapped with the economic downturn. The U.S. economy is not headed for recession; instead, we are seeing a market reset that is not entirely unexpected. Markets are likely to be extremely choppy over these next months, and we may see additional corrections.

-We subscribe to more passive investment allocations (low cost, high volume ETFs) when the market is steadily rising with relatively low volatility. However, in high volatility and choppy markets, we believe active managers outperform. For example, in a recent study by Royce Funds it was determined that active management proves successful with superior risk management than passive management, particularly during periods of market volatility. When the standard deviation was the highest – averaging a scary 29.29 – active managers beat the index by an average of 2.22 percentage points. In quintile 4, where the standard deviation averaged 21.53, the active managers outperformed the index by an average of 1.98 percentage points. With regard to performance, in a in the July/August 2013 issue of the Financial Analysts Journal a study found that “high active share” funds, in aggregate, beat their benchmarks by 1.26% a year after fees and expenses (Authored by Antti Petajisto).

-William Dudley, president and chief executive of the New York Fed, remarked that “the decision to begin the normalization process at the September FOMC meeting seems less compelling”. However, recent data releases have shown pockets of strength in the domestic economy and this keeps the door open to a September rate hike – but December rate move is more likely.

Post
https://twitter.com/MontecitoCapMgt
Post